Regions Bank 2009 Annual Report Download - page 153
Download and view the complete annual report
Please find page 153 of the 2009 Regions Bank annual report below. You can navigate through the pages in the report by either clicking on the pages listed below, or by using the keyword search tool below to find specific information within the annual report.-
 1
1 -
2
-
3
-
4
-
5
-
6
-
7
-
8
-
9
-
10
-
11
-
12
-
13
-
14
-
15
-
16
-
17
-
18
-
19
-
20
-
21
-
22
-
23
-
24
-
25
-
26
-
27
-
28
-
29
-
30
-
31
-
32
-
33
-
34
-
35
-
36
-
37
-
38
-
39
-
40
-
41
-
42
-
43
-
44
-
45
-
46
-
47
-
48
-
49
-
50
-
51
-
52
-
53
-
54
-
55
-
56
-
57
-
58
-
59
-
60
-
61
-
62
-
63
-
64
-
65
-
66
-
67
-
68
-
69
-
70
-
71
-
72
-
73
-
74
-
75
-
76
-
77
-
78
-
79
-
80
-
81
-
82
-
83
-
84
-
85
-
86
-
87
-
88
-
89
-
90
-
91
-
92
-
93
-
94
-
95
-
96
-
97
-
98
-
99
-
100
-
101
-
102
-
103
-
104
-
105
-
106
-
107
-
108
-
109
-
110
-
111
-
112
-
113
-
114
-
115
-
116
-
117
-
118
-
119
-
120
-
121
-
122
-
123
-
124
-
125
-
126
-
127
-
128
-
129
-
130
-
131
-
132
-
133
-
134
-
135
-
136
-
137
-
138
-
139
-
140
-
141
-
142
-
 143
143 -
 144
144 -
 145
145 -
 146
146 -
 147
147 -
 148
148 -
 149
149 -
 150
150 -
 151
151 -
 152
152 -
 153
153 -
 154
154 -
 155
155 -
 156
156 -
 157
157 -
 158
158 -
 159
159 -
 160
160 -
 161
161 -
 162
162 -
 163
163 -
164
-
165
-
166
-
167
-
168
-
169
-
170
-
171
-
172
-
173
-
174
-
175
-
176
-
177
-
178
-
179
-
180
-
181
-
182
-
183
-
184
-
185
-
186
-
187
-
188
-
189
-
190
-
191
-
192
-
193
-
194
-
195
-
196
-
197
-
198
-
199
-
200
-
201
-
202
-
203
-
204
-
205
-
206
-
207
-
208
-
209
-
210
-
211
-
212
-
213
-
214
-
215
-
216
-
217
-
218
-
219
-
220
 |
 |

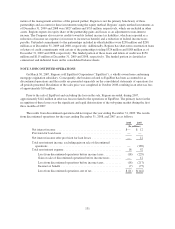
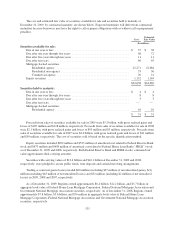
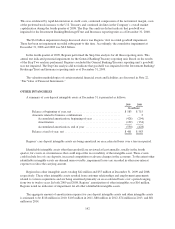
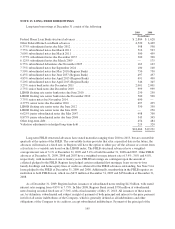
The following table summarizes amounts recognized in the consolidated financial statements related to
securitization transactions for the years ended December 31:
2009 2008 2007
(In millions)
Proceeds from securitizations ...................................... $— $ 42 $423
Net gains ...................................................... — — 2
Servicing fees received ........................................... — 1 3
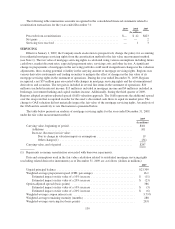
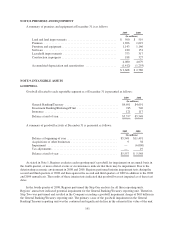
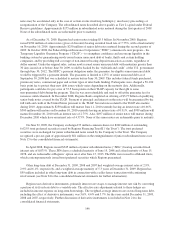
SERVICING
Effective January 1, 2009, the Company made an election to prospectively change the policy for accounting
for residential mortgage servicing rights from the amortization method to the fair value measurement method
(see Note 1). The fair value of mortgage servicing rights is calculated using various assumptions including future
cash flows, market discount rates, expected prepayment rates, servicing costs and other factors. A significant
change in prepayments of mortgages in the servicing portfolio could result in significant changes in the valuation
adjustments, thus creating potential volatility in the carrying amount of mortgage servicing rights. Regions uses
various derivative instruments and trading securities to mitigate the effect of changes in the fair value of its
mortgage servicing rights in the statement of operations. During the year ended December 31, 2009, Regions
recognized a net $37 million gain associated with changes in mortgage servicing rights and the aforementioned
derivatives and securities. The net gain is included in several line items in the statement of operations; $20
million is included in interest income, $13 million is included in mortgage income and $4 million is included in
brokerage, investment banking and capital markets income. Additionally, during the third quarter of 2009,
Regions adopted an option-adjusted spread (OAS) valuation approach. The OAS represents the additional spread
over the swap rate that is required in order for the asset’s discounted cash flows to equal its market price. The
change to OAS valuation did not materially impact the fair value of the mortgage servicing rights. An analysis of
the OAS and its sensitivity to rate fluctuations is presented below.
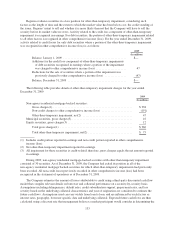
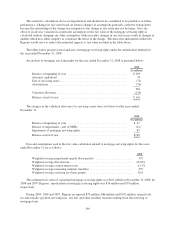
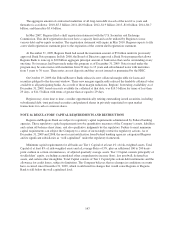
The table below presents an analysis of mortgage servicing rights for the year ended December 31, 2009,
under the fair value measurement method:
2009
(In millions)
Carrying value, beginning of period ........................................... $161
Additions ........................................................... 101
Increase (decrease) in fair value:
Due to change in valuation inputs or assumptions ........................ 19
Other changes(1) ................................................. (34)
Carrying value, end of period ................................................ $247
(1) Represents economic amortization associated with borrower repayments.
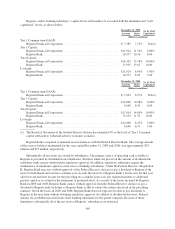
Data and assumptions used in the fair value calculation related to residential mortgage servicing rights
(excluding related derivative instruments) as of December 31, 2009 are as follows (dollars in millions):
2009
Unpaid principal balance ..................................................... $23,309
Weighted-average prepayment speed (CPR; percentage) ............................ 16.1
Estimated impact on fair value of a 10% increase .............................. $ (11)
Estimated impact on fair value of a 20% increase .............................. $ (23)
Option-adjusted spread (basis points) ........................................... 386
Estimated impact on fair value of a 10% increase .............................. $ (3)
Estimated impact on fair value of a 20% increase .............................. $ (6)
Weighted-average coupon interest rate .......................................... 5.79%
Weighted-average remaining maturity (months) ................................... 288
Weighted-average servicing fee (basis points) .................................... 28.8
139