Regions Bank 2009 Annual Report Download - page 138
Download and view the complete annual report
Please find page 138 of the 2009 Regions Bank annual report below. You can navigate through the pages in the report by either clicking on the pages listed below, or by using the keyword search tool below to find specific information within the annual report.-
 1
1 -
2
-
3
-
4
-
5
-
6
-
7
-
8
-
9
-
10
-
11
-
12
-
13
-
14
-
15
-
16
-
17
-
18
-
19
-
20
-
21
-
22
-
23
-
24
-
25
-
26
-
27
-
28
-
29
-
30
-
31
-
32
-
33
-
34
-
35
-
36
-
37
-
38
-
39
-
40
-
41
-
42
-
43
-
44
-
45
-
46
-
47
-
48
-
49
-
50
-
51
-
52
-
53
-
54
-
55
-
56
-
57
-
58
-
59
-
60
-
61
-
62
-
63
-
64
-
65
-
66
-
67
-
68
-
69
-
70
-
71
-
72
-
73
-
74
-
75
-
76
-
77
-
78
-
79
-
80
-
81
-
82
-
83
-
84
-
85
-
86
-
87
-
88
-
89
-
90
-
91
-
92
-
93
-
94
-
95
-
96
-
97
-
98
-
99
-
100
-
101
-
102
-
103
-
104
-
105
-
106
-
107
-
108
-
109
-
110
-
111
-
112
-
113
-
114
-
115
-
116
-
117
-
118
-
119
-
120
-
121
-
122
-
123
-
124
-
125
-
126
-
127
-
 128
128 -
 129
129 -
 130
130 -
 131
131 -
 132
132 -
 133
133 -
 134
134 -
 135
135 -
 136
136 -
 137
137 -
 138
138 -
 139
139 -
 140
140 -
 141
141 -
 142
142 -
 143
143 -
 144
144 -
 145
145 -
 146
146 -
 147
147 -
 148
148 -
149
-
150
-
151
-
152
-
153
-
154
-
155
-
156
-
157
-
158
-
159
-
160
-
161
-
162
-
163
-
164
-
165
-
166
-
167
-
168
-
169
-
170
-
171
-
172
-
173
-
174
-
175
-
176
-
177
-
178
-
179
-
180
-
181
-
182
-
183
-
184
-
185
-
186
-
187
-
188
-
189
-
190
-
191
-
192
-
193
-
194
-
195
-
196
-
197
-
198
-
199
-
200
-
201
-
202
-
203
-
204
-
205
-
206
-
207
-
208
-
209
-
210
-
211
-
212
-
213
-
214
-
215
-
216
-
217
-
218
-
219
-
220
 |
 |

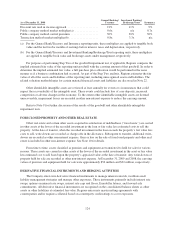
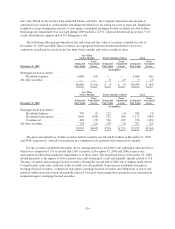
As of December 31, 2008
General Banking/
Treasury
Investment Banking/
Brokerage/Trust Insurance
Discount rate used in income approach ..................... 21% 11% 9%
Public company method market multiplier(a) ................ 0.6x n/a 8.7x
Public company method control premium ................... 30% 30% 30%
Transaction method market multiplier(b) .................... 0.8x 3.3x n/a
(a) For the General Bank/Treasury and Insurance reporting units, these multipliers are applied to tangible book
value and the last twelve months of earnings before interest, taxes and depreciation, respectively.
(b) For the General Bank/Treasury and Investment Banking/Brokerage/Trust reporting units, these multipliers
are applied to tangible book value and brokerage assets under management, respectively.
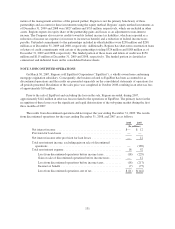
For purposes of performing Step Two of the goodwill impairment test, if applicable, Regions compares the
implied estimated fair value of the reporting unit goodwill with the carrying amount of that goodwill. In order to
determine the implied estimated fair value, a full purchase price allocation would be performed in the same
manner as if a business combination had occurred. As part of the Step Two analysis, Regions estimates the fair
value of all of the assets and liabilities of the reporting unit, including unrecognized assets and liabilities. The
related valuation methodologies for certain material financial assets and liabilities are discussed in Note 22.
Other identifiable intangible assets are reviewed at least annually for events or circumstances that could
impact the recoverability of the intangible asset. These events could include loss of core deposits, increased
competition or adverse changes in the economy. To the extent other identifiable intangible assets are deemed
unrecoverable, impairment losses are recorded in other non-interest expense to reduce the carrying amount.
Refer to Note 9 for further discussion of the results of the goodwill and other identifiable intangibles
impairment tests.
FORECLOSED PROPERTY AND OTHER REAL ESTATE
Other real estate and certain other assets acquired in satisfaction of indebtedness (“foreclosure”) are carried
in other assets at the lower of the recorded investment in the loan or fair value less estimated costs to sell the
property. At the date of transfer, when the recorded investment in the loan exceeds the property’s fair value less
costs to sell, write-downs are recorded as charge-offs in the allowance. Subsequent to transfer, additional write-
downs are recorded as other non-interest expense. Gain or loss on the sale of foreclosed property and other real
estate is included in other non-interest expense. See Note 10 for details.
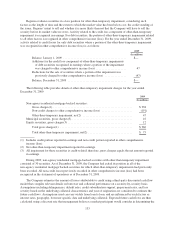
From time to time, assets classified as premises and equipment are transferred to held for sale for various
reasons. These assets are carried in other assets at the lower of the recorded investment in the asset or fair value
less estimated cost to sell based upon the property’s appraised value at the date of transfer. Any write-downs of
property held for sale are recorded as other non-interest expense. At December 31, 2009 and 2008, the carrying
values of premises and equipment held for sale were approximately $56 million and $32 million, respectively.
DERIVATIVE FINANCIAL INSTRUMENTS AND HEDGING ACTIVITIES
The Company enters into derivative financial instruments to manage interest rate risk, facilitate asset/
liability management strategies and manage other exposures. These instruments primarily include interest rate
swaps, options on interest rate swaps, interest rate caps and floors, Eurodollar futures, and forward sale
commitments. All derivative financial instruments are recognized on the consolidated balance sheets as other
assets or other liabilities at estimated fair value. Regions enters into master netting agreements with
counterparties and/or requires collateral based on counterparty credit ratings to cover exposures.
124