Regions Bank 2009 Annual Report Download - page 70
Download and view the complete annual report
Please find page 70 of the 2009 Regions Bank annual report below. You can navigate through the pages in the report by either clicking on the pages listed below, or by using the keyword search tool below to find specific information within the annual report.-
 1
1 -
2
-
3
-
4
-
5
-
6
-
7
-
8
-
9
-
10
-
11
-
12
-
13
-
14
-
15
-
16
-
17
-
18
-
19
-
20
-
21
-
22
-
23
-
24
-
25
-
26
-
27
-
28
-
29
-
30
-
31
-
32
-
33
-
34
-
35
-
36
-
37
-
38
-
39
-
40
-
41
-
42
-
43
-
44
-
45
-
46
-
47
-
48
-
49
-
50
-
51
-
52
-
53
-
54
-
55
-
56
-
57
-
58
-
59
-
 60
60 -
 61
61 -
 62
62 -
 63
63 -
 64
64 -
 65
65 -
 66
66 -
 67
67 -
 68
68 -
 69
69 -
 70
70 -
 71
71 -
 72
72 -
 73
73 -
 74
74 -
 75
75 -
 76
76 -
 77
77 -
 78
78 -
 79
79 -
 80
80 -
81
-
82
-
83
-
84
-
85
-
86
-
87
-
88
-
89
-
90
-
91
-
92
-
93
-
94
-
95
-
96
-
97
-
98
-
99
-
100
-
101
-
102
-
103
-
104
-
105
-
106
-
107
-
108
-
109
-
110
-
111
-
112
-
113
-
114
-
115
-
116
-
117
-
118
-
119
-
120
-
121
-
122
-
123
-
124
-
125
-
126
-
127
-
128
-
129
-
130
-
131
-
132
-
133
-
134
-
135
-
136
-
137
-
138
-
139
-
140
-
141
-
142
-
143
-
144
-
145
-
146
-
147
-
148
-
149
-
150
-
151
-
152
-
153
-
154
-
155
-
156
-
157
-
158
-
159
-
160
-
161
-
162
-
163
-
164
-
165
-
166
-
167
-
168
-
169
-
170
-
171
-
172
-
173
-
174
-
175
-
176
-
177
-
178
-
179
-
180
-
181
-
182
-
183
-
184
-
185
-
186
-
187
-
188
-
189
-
190
-
191
-
192
-
193
-
194
-
195
-
196
-
197
-
198
-
199
-
200
-
201
-
202
-
203
-
204
-
205
-
206
-
207
-
208
-
209
-
210
-
211
-
212
-
213
-
214
-
215
-
216
-
217
-
218
-
219
-
220
 |
 |

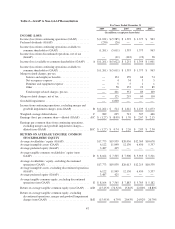
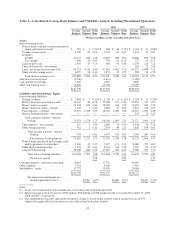
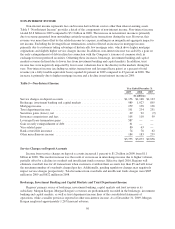
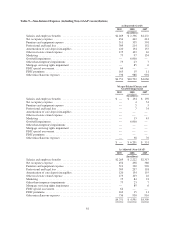
NON-INTEREST INCOME
Non-interest income represents fees and income derived from sources other than interest-earning assets.
Table 5 “Non-Interest Income” provides a detail of the components of non-interest income. Non-interest income
totaled $3.8 billion in 2009 compared to $3.1 billion in 2008. The increase in non-interest income is primarily
due to revenue generated from unwinding certain leveraged lease transactions during the year. However, this
revenue was more than offset by the related income tax expense, resulting in an insignificant aggregate impact to
net income. Excluding the leveraged lease terminations, results reflected an increase in mortgage income,
primarily due to customers taking advantage of historically low mortgage rates, which drove higher mortgage
originations and slightly higher service charges income. In addition, non-interest income was aided by a gain on
the early extinguishment of debt realized in connection with the Company’s issuance of common stock in
exchange for trust preferred securities. Offsetting these increases, brokerage, investment banking and capital
markets revenue declined due to lower fees from investment banking and capital markets. In addition, trust
income fees were negatively impacted by lower asset valuations due to the disarray in the markets during the
year. Non-interest income (excluding securities transactions and leveraged lease gains) as a percent of total
revenue (on a fully taxable-equivalent basis) equaled 44 percent in 2009 compared to 43 percent in 2008. The
increase is primarily due to higher mortgage income and a decline in net interest income in 2009.
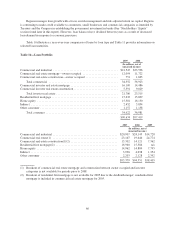
Table 5—Non-Interest Income
Year Ended December 31
2009 2008 2007
(In millions)
Service charges on deposit accounts ....................................... $1,156 $1,148 $1,163
Brokerage, investment banking and capital markets ........................... 989 1,027 895
Mortgage income ...................................................... 259 138 136
Trust department income ................................................ 191 234 251
Securities gains (losses), net ............................................. 69 92 (9)
Insurance commissions and fees .......................................... 105 110 99
Leveraged lease termination gains ......................................... 587 — —
Gain on early extinguishment of debt ...................................... 61 — —
Visa-related gains ...................................................... 80 63 —
Bank-owned life insurance ............................................... 74 78 62
Other miscellaneous income ............................................. 184 183 259
$3,755 $3,073 $2,856
Service Charges on Deposit Accounts
Income from service charges on deposit accounts increased 1 percent to $1.2 billion in 2009 from $1.1
billion in 2008. This modest increase was the result of an increase in interchange income due to higher volumes,
partially offset by a decline in overdraft and insufficient funds revenues. Effective April 2010, Regions will
eliminate overdraft fees for all transactions when customers overdraw their accounts less than $5 and will lower
the maximum number of overdrafts charged per day. Additionally, pending regulatory changes may negatively
impact service charges prospectively. Total revenues from overdrafts and insufficient funds charges were $605
million in 2009 and $622 million in 2008.
Brokerage, Investment Banking and Capital Markets and Trust Department Income
Regions’ primary source of brokerage, investment banking, capital markets and trust revenue is its
subsidiary, Morgan Keegan. Morgan Keegan’s revenues are predominantly recorded in the brokerage, investment
banking and capital markets, as well as trust department income lines of the consolidated statements of
operations, while a smaller portion is reported in other non-interest income. As of December 31, 2009, Morgan
Keegan employed approximately 1,267 financial advisors.
56