Regions Bank 2009 Annual Report Download - page 100
Download and view the complete annual report
Please find page 100 of the 2009 Regions Bank annual report below. You can navigate through the pages in the report by either clicking on the pages listed below, or by using the keyword search tool below to find specific information within the annual report.-
 1
1 -
2
-
3
-
4
-
5
-
6
-
7
-
8
-
9
-
10
-
11
-
12
-
13
-
14
-
15
-
16
-
17
-
18
-
19
-
20
-
21
-
22
-
23
-
24
-
25
-
26
-
27
-
28
-
29
-
30
-
31
-
32
-
33
-
34
-
35
-
36
-
37
-
38
-
39
-
40
-
41
-
42
-
43
-
44
-
45
-
46
-
47
-
48
-
49
-
50
-
51
-
52
-
53
-
54
-
55
-
56
-
57
-
58
-
59
-
60
-
61
-
62
-
63
-
64
-
65
-
66
-
67
-
68
-
69
-
70
-
71
-
72
-
73
-
74
-
75
-
76
-
77
-
78
-
79
-
80
-
81
-
82
-
83
-
84
-
85
-
86
-
87
-
88
-
89
-
 90
90 -
 91
91 -
 92
92 -
 93
93 -
 94
94 -
 95
95 -
 96
96 -
 97
97 -
 98
98 -
 99
99 -
 100
100 -
 101
101 -
 102
102 -
 103
103 -
 104
104 -
 105
105 -
 106
106 -
 107
107 -
 108
108 -
 109
109 -
 110
110 -
111
-
112
-
113
-
114
-
115
-
116
-
117
-
118
-
119
-
120
-
121
-
122
-
123
-
124
-
125
-
126
-
127
-
128
-
129
-
130
-
131
-
132
-
133
-
134
-
135
-
136
-
137
-
138
-
139
-
140
-
141
-
142
-
143
-
144
-
145
-
146
-
147
-
148
-
149
-
150
-
151
-
152
-
153
-
154
-
155
-
156
-
157
-
158
-
159
-
160
-
161
-
162
-
163
-
164
-
165
-
166
-
167
-
168
-
169
-
170
-
171
-
172
-
173
-
174
-
175
-
176
-
177
-
178
-
179
-
180
-
181
-
182
-
183
-
184
-
185
-
186
-
187
-
188
-
189
-
190
-
191
-
192
-
193
-
194
-
195
-
196
-
197
-
198
-
199
-
200
-
201
-
202
-
203
-
204
-
205
-
206
-
207
-
208
-
209
-
210
-
211
-
212
-
213
-
214
-
215
-
216
-
217
-
218
-
219
-
220
 |
 |
counterparty and there is a legally enforceable master netting agreement in place, the exposure represents the net
of the gain and loss positions with and collateral received from and/or posted to that counterparty. The “Credit
Risk” section in this report contains more information on the management of credit risk.
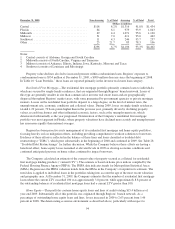
Regions also uses derivatives to meet the needs of its customers. Interest rate swaps, interest rate options
and foreign exchange forwards are the most common derivatives sold to customers. Other derivatives
instruments with similar characteristics are used to hedge the market risk and minimize volatility associated with
this portfolio. Instruments used to service customers are held in the trading account, with changes in value
recorded in the consolidated statements of operations.
On January 1, 2009, Regions began accounting for mortgage servicing rights at fair market value with any
changes to fair value being recorded within mortgage income. Also, in early 2009, Regions entered into
derivative and balance sheet transactions to mitigate the impact of market value fluctuations related to mortgage
servicing rights. Both the mortgage servicing rights and related economic risk mitigation transactions expose the
Company to interest rate risk.
The primary objective of Regions’ hedging strategies is to mitigate the impact of interest rate changes, from
an economic perspective, on net interest income and the net present value of its balance sheet. The overall
effectiveness of these hedging strategies is subject to market conditions, the quality of Regions’ execution, the
accuracy of its valuation assumptions, counterparty credit risk and changes in interest rates. As a result, Regions’
hedging strategies may be ineffective in mitigating the impact of interest rate changes on its earnings. See Note
21 “Derivative Financial Instruments and Hedging Activities” to the consolidated financial statements for a
tabular summary of Regions’ year-end derivatives positions. Derivative instruments entered into in the future
could be materially different from the current risk profile of Regions’ current portfolio.
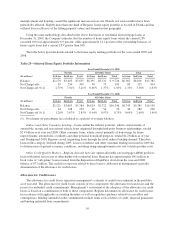
PREPAYMENT RISK
Regions, like most financial institutions, is subject to changing prepayment speeds on mortgage-related
assets under different interest rate environments. Prepayment risk is a significant risk to earnings and specifically
to net interest income. For example, mortgage loans and other financial assets may be prepaid by a debtor, so that
the debtor may refinance its obligations at lower rates. As loans and other financial assets prepay in a falling rate
environment, Regions must reinvest these funds in lower-yielding assets. Prepayments of assets carrying higher
rates reduce Regions’ interest income and overall asset yields. Conversely, in a rising rate environment, these
assets will prepay at a slower rate, resulting in opportunity cost by not having the cash flow to reinvest at higher
rates. Regions’ greatest exposure to prepayment risks primarily rests in its mortgage-backed securities portfolio,
the mortgage fixed-rate loan portfolio and the mortgage servicing asset, all of which tend to be sensitive to
interest rate movements. Prepayments on mortgage-backed securities rose during 2009 due to the favorable
mortgage interest rate environment that existed for the majority of the year. However, tighter lending standards,
decreased home prices, and lingering uncertainty surrounding the economic environment restrained otherwise
higher prepayment speeds. Regions also has prepayment risk that would be reflected in non-interest income in
the form of servicing income on loans sold. Regions actively monitors prepayment exposure as part of its overall
net interest income forecasting and interest rate risk management. In particular, because interest rates are
currently relatively low, Regions is actively managing exposure to declining prepayments that are expected to
coincide with increasing interest rates in both the loan and securities portfolios.
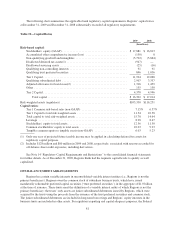
LIQUIDITY RISK
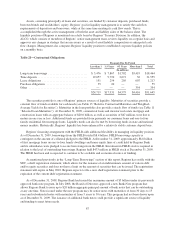
Liquidity is an important factor in the financial condition of Regions and affects Regions’ ability to meet the
borrowing needs and deposit withdrawal requirements of its customers. Table 21 “Contractual Obligations”
summarizes Regions’ contractual cash obligations at December 31, 2009. Regions intends to fund obligations
primarily through cash generated from normal operations. In addition to these obligations, Regions has
obligations related to potential litigation contingencies (see Note 24 “Commitments, Contingencies and
Guarantees” to the consolidated financial statements).
86