Radio Shack 2008 Annual Report Download - page 89
Download and view the complete annual report
Please find page 89 of the 2008 Radio Shack annual report below. You can navigate through the pages in the report by either clicking on the pages listed below, or by using the keyword search tool below to find specific information within the annual report.-
 1
1 -
2
-
3
-
4
-
5
-
6
-
7
-
8
-
9
-
10
-
11
-
12
-
13
-
14
-
15
-
16
-
17
-
18
-
19
-
20
-
21
-
22
-
23
-
24
-
25
-
26
-
27
-
28
-
29
-
30
-
31
-
32
-
33
-
34
-
35
-
36
-
37
-
38
-
39
-
40
-
41
-
42
-
43
-
44
-
45
-
46
-
47
-
48
-
49
-
50
-
51
-
52
-
53
-
54
-
55
-
56
-
57
-
58
-
59
-
60
-
61
-
62
-
63
-
64
-
65
-
66
-
67
-
68
-
69
-
70
-
71
-
72
-
73
-
74
-
75
-
76
-
77
-
78
-
 79
79 -
 80
80 -
 81
81 -
 82
82 -
 83
83 -
 84
84 -
 85
85 -
 86
86 -
 87
87 -
 88
88 -
 89
89 -
 90
90 -
 91
91 -
 92
92
 |
 |

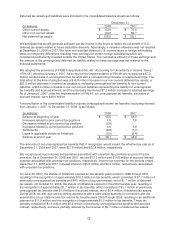
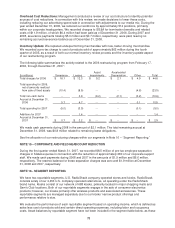
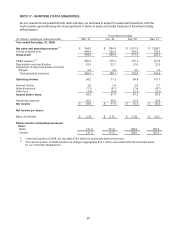
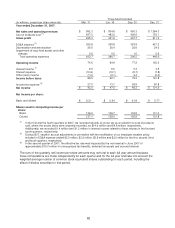
Three Months Ended
(In millions, except per share amounts) Mar. 31 Jun. 30 Sep. 30 Dec. 31
Year ended December 31, 2007:
Net sales and operating revenues $ 992.3 $ 934.8 $ 960.3 $ 1,364.3
Cost of products sold (1) 497.0 483.2 492.6 753.1
Gross profit 495.3 451.6 467.7 611.2
SG&A expense (2) 393.6 359.8 363.9 421.2
Depreciation and amortization 26.5 26.4 25.6 24.2
Impairment of long-lived assets and other
charges
0.6
0.5
1.0
0.6
Total operating expenses 420.7 386.7 390.5 446.0
Operating income 74.6 64.9 77.2 165.2
Interest income (1) 6.5 6.0 5.3 4.8
Interest expense (10.6) (10.7) (9.7) (7.8)
Other (loss) income (1.0) (0.1) 2.4 (0.4)
Income before taxes 69.5 60.1 75.2 161.8
Income tax expense (3) 27.0 13.1 28.9 60.8
Net income $ 42.5 $ 47.0 $ 46.3 $ 101.0
Net income per share:
Basic and diluted $ 0.31 $ 0.34 $ 0.34 $ 0.77
Shares used in computing income per
share:
Basic 136.2 136.7 134.5 131.2
Diluted 137.1 139.0 135.9 131.8
(1) In the first and the fourth quarters of 2007, we recorded refunds of excise tax as a reduction to cost of products
sold, where the excise taxes were originally recorded, as $14.0 million and $4.8 million, respectively.
Additionally, we recorded $1.4 million and $1.2 million in interest income related to these refunds in the first and
fourth quarters, respectively.
(2) During 2007, vacation accrual adjustments in connection with the modification of our employee vacation policy
included in SG&A expense totaled $2.0 million, $3.2 million, $5.9 million and $3.2 million for the first, second, third
and fourth quarters, respectively.
(3) In the second quarter of 2007, the effective tax rate was impacted by the net reversal in June 2007 of
approximately $10.0 million in unrecognized tax benefits, deferred tax assets and accrued interest.
The sum of the quarterly net income per share amounts may not total to each full year amount because
these computations are made independently for each quarter and for the full year and take into account the
weighted average number of common stock equivalent shares outstanding for each period, including the
effect of dilutive securities for that period.
82