Radio Shack 2008 Annual Report Download - page 29
Download and view the complete annual report
Please find page 29 of the 2008 Radio Shack annual report below. You can navigate through the pages in the report by either clicking on the pages listed below, or by using the keyword search tool below to find specific information within the annual report.-
 1
1 -
2
-
3
-
4
-
5
-
6
-
7
-
8
-
9
-
10
-
11
-
12
-
13
-
14
-
15
-
16
-
17
-
18
-
 19
19 -
 20
20 -
 21
21 -
 22
22 -
 23
23 -
 24
24 -
 25
25 -
 26
26 -
 27
27 -
 28
28 -
 29
29 -
 30
30 -
 31
31 -
 32
32 -
 33
33 -
 34
34 -
 35
35 -
 36
36 -
 37
37 -
 38
38 -
 39
39 -
40
-
41
-
42
-
43
-
44
-
45
-
46
-
47
-
48
-
49
-
50
-
51
-
52
-
53
-
54
-
55
-
56
-
57
-
58
-
59
-
60
-
61
-
62
-
63
-
64
-
65
-
66
-
67
-
68
-
69
-
70
-
71
-
72
-
73
-
74
-
75
-
76
-
77
-
78
-
79
-
80
-
81
-
82
-
83
-
84
-
85
-
86
-
87
-
88
-
89
-
90
-
91
-
92
 |
 |

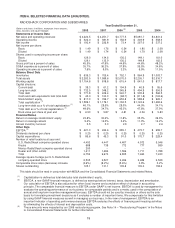
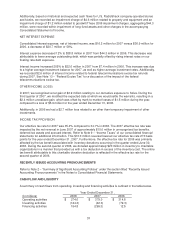
RESULTS OF OPERATIONS
NET SALES AND OPERATING REVENUES
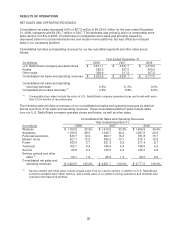
Consolidated net sales decreased 0.6% or $27.2 million to $4,224.5 million for the year ended December
31, 2008, compared with $4,251.7 million in 2007. This decrease was primarily due to a comparable store
sales decline of 0.6% in 2008. The decrease in comparable store sales was primarily caused by
decreased sales in our personal electronics and modern home platforms, but was offset by increased
sales in our accessory platform.
Consolidated net sales and operating revenues for our two reportable segments and other sales are as
follows:
Year Ended December 31,
(In millions) 2008 2007
2006
U.S. RadioShack company-operated stores $ 3,611.1 $ 3,637.7 $ 4,079.8
Kiosks 283.5 297.0 340.5
Other sales 329.9 317.0 357.2
Consolidated net sales and operating revenues $ 4,224.5 $ 4,251.7 $ 4,777.5
Consolidated net sales and operating
revenues decrease
0.6%
11.0%
6.0%
Comparable store sales decrease (1) 0.6% 8.2% 5.6%
(1) Comparable store sales include the sales of U.S. RadioShack company-operated stores and kiosks with more
than 12 full months of recorded sales.
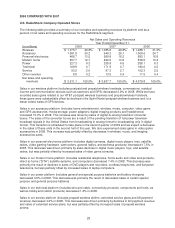
The following table provides a summary of our consolidated net sales and operating revenues by platform
and as a percent of net sales and operating revenues. These consolidated platform sales include sales
from our U.S. RadioShack company-operated stores and kiosks, as well as other sales.
Consolidated Net Sales and Operating Revenues
Year Ended December 31,
(In millions) 2008 2007 2006
Wireless $ 1,393.8 33.0% $ 1,416.5 33.3% $ 1,654.8 34.6%
Accessory 1,183.9 28.0 1,029.7 24.2 1,087.6 22.8
Personal electronics 545.7 12.9 650.7 15.3 751.8 15.7
Modern home 527.1 12.5 556.2 13.1 612.1 12.8
Power 242.4 5.7 251.3 5.9 271.4 5.7
Technical 183.7 4.4 184.4 4.3 198.5 4.2
Service 95.8 2.3 100.5 2.4 106.3 2.2
Service centers and other
sales
(1)
52.1
1.2
62.4
1.5
95.0
2.0
Consolidated net sales and
operating revenues
$ 4,224.5
100.0%
$ 4,251.7
100.0%
$ 4,777.5
100.0%
(1) Service centers and other sales include outside sales from our service centers, in addition to U.S. RadioShack
company-operated store repair revenue, and outside sales of our global sourcing operations and domestic and
overseas manufacturing facilities.
22