Radio Shack 2008 Annual Report Download - page 39
Download and view the complete annual report
Please find page 39 of the 2008 Radio Shack annual report below. You can navigate through the pages in the report by either clicking on the pages listed below, or by using the keyword search tool below to find specific information within the annual report.
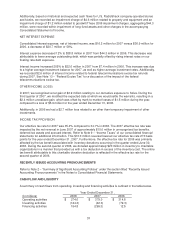
Cash Flow – Operating Activities
Cash flows from operating activities provide us with the majority of our liquidity. Cash provided by
operating activities in 2008 was $274.6 million, compared with $379.0 million and $314.8 million in 2007
and 2006, respectively. Cash flows from operating activities are comprised of net income plus non-cash
adjustments to net income and working capital components. Cash provided by net income plus non-cash
adjustments to net income was $339.5 million, $358.9 million, and $230.7 million for 2008, 2007, and
2006, respectively. Cash used in working capital components was $64.9 million in 2008 compared with
cash provided by working capital components of $20.1 million and $84.1 million in 2007 and 2006,
respectively.
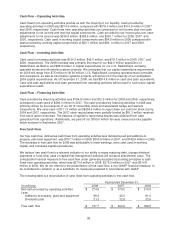
Cash Flow – Investing Activities
Cash used in investing activities was $124.3 million, $42.0 million, and $79.3 million in 2008, 2007, and
2006, respectively. The 2008 increase was primarily the result of our $42.0 million acquisition of
RadioShack de Mexico and $85.6 million in capital expenditures for our U.S. RadioShack company-
operated stores and information system projects. We anticipate that our capital expenditure requirements
for 2009 will range from $75 million to $100 million. U.S. RadioShack company-operated store remodels
and relocations, as well as information systems projects, will account for the majority of our anticipated
2009 capital expenditures. As of December 31, 2008, we had $814.8 million in cash and cash equivalents.
Cash and cash equivalents and cash generated from operating activities will be used to fund future capital
expenditure needs.
Cash Flow – Financing Activities
Cash provided by financing activities was $154.8 million and $12.5 million for 2008 and 2006, respectively,
compared to cash used of $299.3 million in 2007. The cash provided by financing activities in 2008 was
primarily driven by the issuance of our 2013 convertible notes and associated hedge and warrant
transactions. We used cash of $111.3 million and $208.5 million to repurchase our common stock during
2008 and 2007, respectively. The 2007 stock repurchases were partially funded by $81.3 million received
from stock option exercises. The balance of capital to repurchase shares was obtained from cash
generated from operations. Additionally, we paid off our $150.0 million ten-year unsecured note payable
which matured in September 2007.
Free Cash Flow
Our free cash flow, defined as cash flows from operating activities less dividends paid and additions to
property, plant and equipment, was $157.7 million in 2008, $300.9 million in 2007, and $189.9 million in 2006.
The decrease in free cash flow for 2008 was attributable to lower earnings, more cash used in working
capital, and increased capital expenditures.
We believe free cash flow is a relevant indicator of our ability to repay maturing debt, change dividend
payments or fund other uses of capital that management believes will enhance shareholder value. The
comparable financial measure to free cash flow under generally accepted accounting principles is cash
flows from operating activities, which was $274.6 million in 2008, $379.0 million in 2007, and $314.8
million in 2006. We do not intend for the presentation of free cash flow, a non-GAAP financial measure, to
be considered in isolation or as a substitute for measures prepared in accordance with GAAP.
The following table is a reconciliation of cash flows from operating activities to free cash flow.
Year Ended December 31,
(In millions) 2008 2007
2006
Net cash provided by operating activities $ 274.6 $ 379.0 $ 314.8
Less:
Additions to property, plant and equipment 85.6 45.3 91.0
Dividends paid 31.3 32.8 33.9
Free cash flow $ 157.7 $ 300.9 $ 189.9
32


