Radio Shack 2008 Annual Report Download - page 85
Download and view the complete annual report
Please find page 85 of the 2008 Radio Shack annual report below. You can navigate through the pages in the report by either clicking on the pages listed below, or by using the keyword search tool below to find specific information within the annual report.-
 1
1 -
2
-
3
-
4
-
5
-
6
-
7
-
8
-
9
-
10
-
11
-
12
-
13
-
14
-
15
-
16
-
17
-
18
-
19
-
20
-
21
-
22
-
23
-
24
-
25
-
26
-
27
-
28
-
29
-
30
-
31
-
32
-
33
-
34
-
35
-
36
-
37
-
38
-
39
-
40
-
41
-
42
-
43
-
44
-
45
-
46
-
47
-
48
-
49
-
50
-
51
-
52
-
53
-
54
-
55
-
56
-
57
-
58
-
59
-
60
-
61
-
62
-
63
-
64
-
65
-
66
-
67
-
68
-
69
-
70
-
71
-
72
-
73
-
74
-
 75
75 -
 76
76 -
 77
77 -
 78
78 -
 79
79 -
 80
80 -
 81
81 -
 82
82 -
 83
83 -
 84
84 -
 85
85 -
 86
86 -
 87
87 -
 88
88 -
 89
89 -
 90
90 -
 91
91 -
 92
92
 |
 |

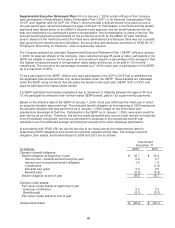
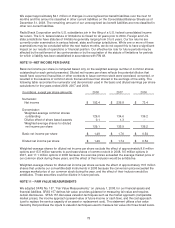
Overhead Cost Reductions: Management conducted a review of our cost structure to identify potential
sources of cost reductions. In connection with this review, we made decisions to lower these costs,
including reducing our advertising spend rate in connection with adjustments to our media mix. During the
year ended December 31, 2006, we reduced our workforce by approximately 514 positions, primarily
within our corporate headquarters. We recorded charges to SG&A for termination benefits and related
costs of $11.9 million, of which $6.4 million had been paid as of December 31, 2006. During 2007 and
2008, severance payments totaling $5.0 million and $0.7 million, respectively, were paid, leaving no
remaining accrued severance balance as of December 31, 2008.
Inventory Update: We replaced underperforming merchandise with new, faster-moving merchandise.
We recorded a pre-tax charge to cost of products sold of approximately $62 million during the fourth
quarter of 2005, as a result of both our normal inventory review process and the inventory update aspect
of our restructuring program.
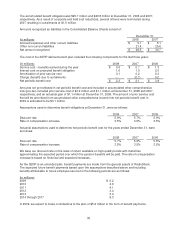
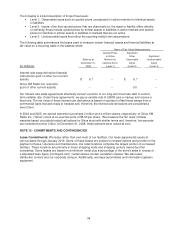
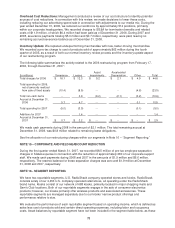
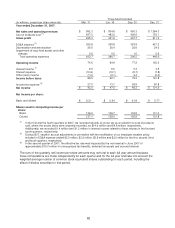
The following table summarizes the activity related to the 2006 restructuring program from February 17,
2006, through December 31, 2007:
Asset Accelerated
(In millions)
Severance Leases Impairments Depreciation Other Total
Total charges for 2006 $ 16.1 $ 12.3 $ 9.2 $ 2.1 $ 4.9 $ 44.6
Total spending for 2006,
net of amounts realized
from sale of fixed assets
(10.4)
(8.5)
--
--
(4.6)
(23.5)
Total non-cash items
--
0.9
(9.2)
(2.1)
(0.2)
(10.6)
Accrual at December 31,
2006
5.7
4.7
--
--
0.1
10.5
Total spending for 2007 (5.0) (3.9) -- -- (0.1) (9.0)
Additions for 2007 1.4 -- -- -- 1.4
Accrual at December 31,
2007
$ 0.7
$ 2.2
$ --
$ --
$ --
$ 2.9
We made cash payments during 2008 in the amount of $2.1 million. The total remaining accrual at
December 31, 2008, was $0.8 million related to remaining lease obligations.
See the allocation of our restructuring charges within our segments in Note 16 – “Segment Reporting.”
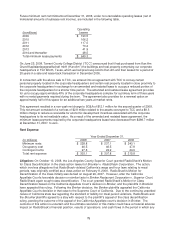
NOTE 15 – CORPORATE AND FIELD HEADCOUNT REDUCTION
During the first quarter ended March 31, 2007, we recorded $8.5 million of pre-tax employee separation
charges in SG&A expense in connection with the reduction of approximately 280 of our corporate support
staff. We made cash payments during 2008 and 2007 in the amounts of $1.9 million and $6.6 million,
respectively. The reserve balance for these separation charges was zero and $1.9 million at December
31, 2008 and 2007, respectively.
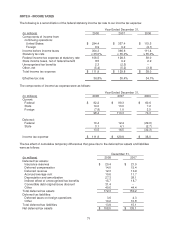
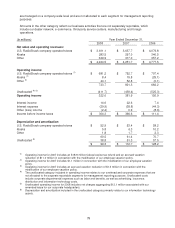
NOTE 16 - SEGMENT REPORTING
We have two reportable segments, U.S. RadioShack company-operated stores and kiosks. RadioShack
consists solely of our 4,453 U.S. company-operated retail stores, all operating under the RadioShack
brand name. Kiosks consist of our network of 688 kiosks, primarily located in major shopping malls and
Sam’s Club locations. Both of our reportable segments engage in the sale of consumer electronics
products; however, our kiosks primarily offer wireless products and associated accessories. These
reportable segments are managed separately due to our kiosks’ narrow product offerings and
performance relative to size.
We evaluate the performance of each reportable segment based on operating income, which is defined as
sales less cost of products sold and certain direct operating expenses, including labor and occupancy
costs. Asset balances by reportable segment have not been included in the segment table below, as these
78