Radio Shack 2008 Annual Report Download - page 38
Download and view the complete annual report
Please find page 38 of the 2008 Radio Shack annual report below. You can navigate through the pages in the report by either clicking on the pages listed below, or by using the keyword search tool below to find specific information within the annual report.-
 1
1 -
2
-
3
-
4
-
5
-
6
-
7
-
8
-
9
-
10
-
11
-
12
-
13
-
14
-
15
-
16
-
17
-
18
-
19
-
20
-
21
-
22
-
23
-
24
-
25
-
26
-
27
-
 28
28 -
 29
29 -
 30
30 -
 31
31 -
 32
32 -
 33
33 -
 34
34 -
 35
35 -
 36
36 -
 37
37 -
 38
38 -
 39
39 -
 40
40 -
 41
41 -
 42
42 -
 43
43 -
 44
44 -
 45
45 -
 46
46 -
 47
47 -
 48
48 -
49
-
50
-
51
-
52
-
53
-
54
-
55
-
56
-
57
-
58
-
59
-
60
-
61
-
62
-
63
-
64
-
65
-
66
-
67
-
68
-
69
-
70
-
71
-
72
-
73
-
74
-
75
-
76
-
77
-
78
-
79
-
80
-
81
-
82
-
83
-
84
-
85
-
86
-
87
-
88
-
89
-
90
-
91
-
92
 |
 |

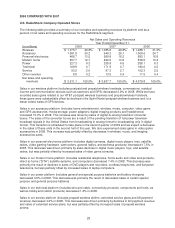
Additionally, based on historical and expected cash flows for U.S. RadioShack company-operated stores
and kiosks, we recorded an impairment charge of $4.6 million related to property and equipment and an
impairment charge of $1.2 million related to goodwill.These 2006 impairment charges, aggregating $44.3
million, were recorded within impairment of long-lived assets and other charges in the accompanying
Consolidated Statement of Income.
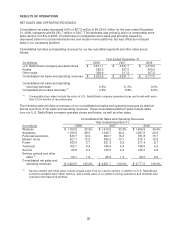
NET INTEREST EXPENSE
Consolidated interest expense, net of interest income, was $16.2 million for 2007 versus $36.9 million for
2006, a decrease of $20.7 million or 56%.
Interest expense decreased 12% to $38.8 million in 2007 from $44.3 million in 2006. This decrease was
attributable to lower average outstanding debt, which was partially offset by rising interest rates on our
floating rate debt exposure.
Interest income increased 205% to $22.6 million in 2007 from $7.4 million in 2006. This increase was due
to a higher average investment balance for 2007, as well as higher average investment rates. Additionally,
we recorded $2.6 million of interest income related to federal telecommunications excise tax refunds
during 2007. See Note 13 – “Federal Excise Tax” for a discussion of the impact of the federal
telecommunications excise tax.
OTHER INCOME (LOSS)
In 2007, we recognized a net gain of $0.9 million relating to our derivative exposure to Sirius. During the
third quarter of 2007, we modified the expected date at which we would settle the warrants, resulting in a
$2.4 million unrealized gain, which was offset by mark-to-market losses of $1.5 million during the year,
compared to a loss of $5.9 million for the year ended December 31, 2006.
Additionally, in 2006 we had a $2.7 million loss related to an other than temporary impairment of other
investments.
INCOME TAX PROVISION
Our effective tax rate for 2007 was 35.4% compared to 34.1% in 2006. The 2007 effective tax rate was
impacted by the net reversal in June 2007 of approximately $10.0 million in unrecognized tax benefits,
deferred tax assets and accrued interest. Refer to Note 9 – “Income Taxes” of our consolidated financial
statements for additional information. This $10.0 million reversal lowered our effective tax rate 273 basis
points for the year ended December 31, 2007. Furthermore, the effective tax rate for 2006 was primarily
affected by the tax benefit associated with inventory donations occurring in the quarter ended June 30,
2006. During the second quarter of 2006, we donated approximately $20 million in inventory to charitable
organizations in a manner that provided us with a tax deduction in excess of the inventory cost. The entire
tax benefit attributable to this charitable donation deduction is reflected in the effective tax rate for the
second quarter of 2006.
RECENTLY ISSUED ACCOUNTING PRONOUNCEMENTS
Refer to Note 2 – “Summary of Significant Accounting Policies” under the section titled “Recently Issued
Accounting Pronouncements” in the Notes to Consolidated Financial Statements.
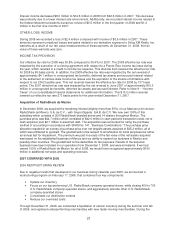
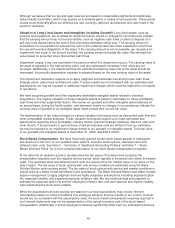
CASH FLOW AND LIQUIDITY
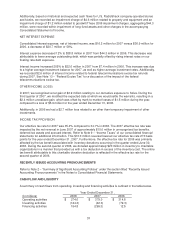
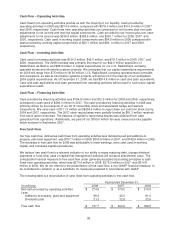
A summary of cash flows from operating, investing and financing activities is outlined in the table below.
Year Ended December 31,
(In millions) 2008 2007 2006
Operating activities $ 274.6 $ 379.0 $ 314.8
Investing activities (124.3) (42.0) (79.3)
Financing activities 154.8 (299.3) 12.5
31