Radio Shack 2008 Annual Report Download - page 26
Download and view the complete annual report
Please find page 26 of the 2008 Radio Shack annual report below. You can navigate through the pages in the report by either clicking on the pages listed below, or by using the keyword search tool below to find specific information within the annual report.-
 1
1 -
2
-
3
-
4
-
5
-
6
-
7
-
8
-
9
-
10
-
11
-
12
-
13
-
14
-
15
-
 16
16 -
 17
17 -
 18
18 -
 19
19 -
 20
20 -
 21
21 -
 22
22 -
 23
23 -
 24
24 -
 25
25 -
 26
26 -
 27
27 -
 28
28 -
 29
29 -
 30
30 -
 31
31 -
 32
32 -
 33
33 -
 34
34 -
 35
35 -
 36
36 -
37
-
38
-
39
-
40
-
41
-
42
-
43
-
44
-
45
-
46
-
47
-
48
-
49
-
50
-
51
-
52
-
53
-
54
-
55
-
56
-
57
-
58
-
59
-
60
-
61
-
62
-
63
-
64
-
65
-
66
-
67
-
68
-
69
-
70
-
71
-
72
-
73
-
74
-
75
-
76
-
77
-
78
-
79
-
80
-
81
-
82
-
83
-
84
-
85
-
86
-
87
-
88
-
89
-
90
-
91
-
92
 |
 |

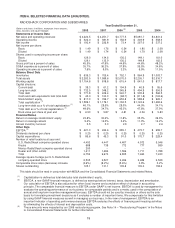
ITEM 6. SELECTED FINANCIAL DATA (UNAUDITED).
RADIOSHACK CORPORATION AND SUBSIDIARIES
Year Ended December 31,
(Dollars and shares in millions, except per share amounts,
ratios, locations and square footage) 2008 2007 2006
(3) 2005 2004
Statements of Income Data
Net sales and operating revenues $ 4,224.5 $ 4,251.7 $ 4,777.5 $ 5,081.7 $ 4,841.2
Operating income $ 322.0 $ 381.9 $ 156.9 $ 349.9 $ 558.3
Net income $ 192.4 $ 236.8 $ 73.4 $ 267.0 $ 337.2
Net income per share:
Basic $ 1.49 $ 1.76 $ 0.54 $ 1.80 $ 2.09
Diluted $ 1.49 $ 1.74 $ 0.54 $ 1.79 $ 2.08
Shares used in computing income per share:
Basic 129.0 134.6 136.2 148.1 161.0
Diluted 129.1 135.9 136.2 148.8 162.5
Gross profit as a percent of sales 45.5% 47.6% 44.6% 44.6% 48.2%
SG&A expense as a percent of sales 35.7% 36.2% 37.9% 35.5% 34.8%
Operating income as a percent of sales 7.6% 9.0% 3.3% 6.9% 11.5%
Balance Sheet Data
Inventories $ 636.3 $ 705.4 $ 752.1 $ 964.9 $ 1,003.7
Total assets $ 2,283.5 $ 1,989.6 $ 2,070.0 $ 2,205.1 $ 2,516.7
Working capital $ 1,154.8 $ 818.8 $ 615.4 $ 641.0 $ 817.7
Capital structure:
Current debt $ 39.3 $ 61.2 $ 194.9 $ 40.9 $ 55.6
Long-term debt $ 732.5 $ 348.2 $ 345.8 $ 494.9 $ 506.9
Total debt $ 771.8 $ 409.4 $ 540.7 $ 535.8 $ 562.5
Cash and cash equivalents less total debt $ 43.0 $ 100.3 $ (68.7) $ (311.8) $ (124.6)
Stockholders' equity $ 817.3 $ 769.7 $ 653.8 $ 588.8 $ 922.1
Total capitalization
(1) $ 1,589.1 $ 1,179.1 $ 1,194.5 $ 1,124.6 $ 1,484.6
Long-term debt as a % of total capitalization (1) 46.1% 29.5% 29.0% 44.0% 34.1%
Total debt as a % of total capitalization (1) 48.6% 34.7% 45.3% 47.6% 37.9%
Book value per share at year end $ 6.53 $ 5.87 $ 4.81 $ 4.36 $ 5.83
Financial Ratios
Return on average stockholders' equity 23.8% 33.2% 11.8% 35.3% 39.9%
Return on average assets 9.4% 12.3% 3.4% 11.3% 14.2%
Annual inventory turnover 3.5 3.3 2.9 2.7 2.6
Other Data
EBITDA (2) $ 421.3 $ 494.6 $ 285.1 $ 473.7 $ 659.7
Dividends declared per share $ 0.25 $ 0.25 $ 0.25 $ 0.25 $ 0.25
Capital expenditures $ 85.6 $ 45.3 $ 91.0 $ 170.7 $ 229.4
Number of retail locations at year end:
U.S. RadioShack company-operated stores 4,453 4,447 4,467 4,972 5,046
Kiosks 688 739 772 777 599
Mexico RadioShack company-operated stores 200 -- -- -- --
Dealer and other outlets 1,411 1,484 1,596 1,711 1,788
Total 6,752 6,670 6,835 7,460 7,433
Average square footage per U.S. RadioShack
company-operated store
2,505
2,527
2,496
2,489
2,529
Comparable store sales (decrease) increase (0.6%) (8.2%) (5.6%) 0.9% 3.2%
Shares outstanding 125.1 131.1 135.8 135.0 158.2
This table should be read in conjunction with MD&A and the Consolidated Financial Statements and related Notes.
(1) Capitalization is defined as total debt plus total stockholders' equity.
(2) EBITDA, a non-GAAP financial measure, is defined as earnings before interest, taxes, depreciation and amortization.
Our calculation of EBITDA is also adjusted for other (loss) income and cumulative effect of change in accounting
principle. The comparable financial measure to EBITDA under GAAP is net income. EBITDA is used by management to
evaluate the operating performance of our business for comparable periods and is a metric used in the computation of
annual and long-term incentive management bonuses. EBITDA should not be used by investors or others as the sole
basis for formulating investment decisions as it excludes a number of important items. We compensate for this limitation
by using GAAP financial measures as well in managing our business. In the view of management, EBITDA is an
important indicator of operating performance because EBITDA excludes the effects of financing and investing activities
by eliminating the effects of interest and depreciation costs.
(3) These amounts were impacted by our 2006 restructuring program. See Note 14 – “Restructuring Program” in the Notes
to Consolidated Financial Statements for further information.
19