Radio Shack 2008 Annual Report Download - page 36
Download and view the complete annual report
Please find page 36 of the 2008 Radio Shack annual report below. You can navigate through the pages in the report by either clicking on the pages listed below, or by using the keyword search tool below to find specific information within the annual report.-
 1
1 -
2
-
3
-
4
-
5
-
6
-
7
-
8
-
9
-
10
-
11
-
12
-
13
-
14
-
15
-
16
-
17
-
18
-
19
-
20
-
21
-
22
-
23
-
24
-
25
-
 26
26 -
 27
27 -
 28
28 -
 29
29 -
 30
30 -
 31
31 -
 32
32 -
 33
33 -
 34
34 -
 35
35 -
 36
36 -
 37
37 -
 38
38 -
 39
39 -
 40
40 -
 41
41 -
 42
42 -
 43
43 -
 44
44 -
 45
45 -
 46
46 -
47
-
48
-
49
-
50
-
51
-
52
-
53
-
54
-
55
-
56
-
57
-
58
-
59
-
60
-
61
-
62
-
63
-
64
-
65
-
66
-
67
-
68
-
69
-
70
-
71
-
72
-
73
-
74
-
75
-
76
-
77
-
78
-
79
-
80
-
81
-
82
-
83
-
84
-
85
-
86
-
87
-
88
-
89
-
90
-
91
-
92
 |
 |

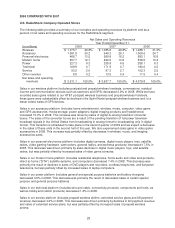
Excluding the effects of the 2006 store closures, sales in our service platform decreased 2.6% in 2007.
Prepaid airtime sales increased for the year ended December 31, 2007; however, this gain was more than
offset by decreases in bill payment revenue. Including the effects of the 2006 store closures, service
platform sales decreased 4.9%.Other revenue decreased $4.0 million or 22.9% in 2007 due in part to the
2006 store closures and to a decline in store repair revenue.
Kiosks
Kiosk sales decreased 12.8% or $43.5 million in 2007. While this decrease is partially attributable to fewer
kiosk locations compared to the prior year, we believe that this sales decline was primarily the result of
increased wireless competition, a challenging wireless industry environment, and a customer shift to
prepaid handsets which are generally priced lower than postpaid handsets.
Other Sales
Other sales in 2006 included sales of our now closed Canadian company-operated stores. Other sales
were down $40.2 million or 11.3% in 2007. This sales decrease was primarily due to the sale or closure of
five service centers late in the second quarter of 2006, fewer dealer outlets in 2007, and a decline in
product sales to the remaining dealers.
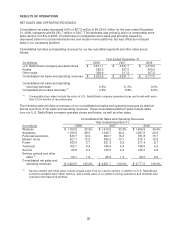
GROSS PROFIT
Consolidated gross profit and gross margin for 2007 were $2,025.8 million and 47.6%, respectively,
compared with $2,129.4 million and 44.6% in 2006 resulting in a 4.9% decrease in gross profit dollars and
a 300 basis point increase in our gross margin.
The decrease in gross profit for 2007 was the result of a decline in net sales and operating revenues
primarily due to a comparable store sales decrease and store closures associated with our 2006
restructuring. Our 2007 gross margin increased primarily due to an improvement in our inventory
management and a shift in product mix. In addition, refunds of $14.0 million and $5.2 million for federal
telecommunications excise taxes were recorded in the first and fourth quarters of 2007, respectively. A
portion of these refunds totaling $18.8 million was recorded as a reduction to cost of products sold, which
accounted for a 44 basis point increase in our gross margin. See Note 13 – “Federal Excise Tax” for a
discussion of the impact of the federal telecommunications excise tax.
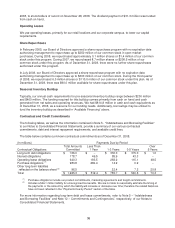
SELLING, GENERAL AND ADMINISTRATIVE (“SG&A”) EXPENSE
Our consolidated SG&A expense decreased 15.0% or $272.2 million in 2007. This represents a 170 basis
point decrease as a percentage of net sales and operating revenues compared to 2006.
Payroll and commissions expense decreased in dollars and as a percentage of net sales and operating
revenues. This decrease was primarily driven by a reduction in our corporate support staff, a reduction of
store personnel from store closures in 2006, and better management of store labor hours. Additionally,
compensation included an $8.5 million charge recorded in the first quarter of 2007 associated with the
reduction of approximately 280 corporate support employees, while the year ended December 31, 2006,
included employee separation charges of approximately $16.1 million connected with the 2006
restructuring. Furthermore, our accrued vacation was reduced $14.3 million in 2007 in connection with the
modification of our employee vacation policy during 2007.
Rent expense decreased in dollars, but increased as a percent of net sales and operating revenues. The
rent decrease was primarily driven by store closures from our 2006 restructuring.
Advertising expense decreased in dollars, but increased as a percent of net sales and operating revenues.
This decrease was primarily due to a change in our media strategy, as we changed the mix of media used
in our advertising program from television to more radio and newspaper usage, as well as reduced
sponsorship programs.
29