Radio Shack 2008 Annual Report Download - page 87
Download and view the complete annual report
Please find page 87 of the 2008 Radio Shack annual report below. You can navigate through the pages in the report by either clicking on the pages listed below, or by using the keyword search tool below to find specific information within the annual report.-
 1
1 -
2
-
3
-
4
-
5
-
6
-
7
-
8
-
9
-
10
-
11
-
12
-
13
-
14
-
15
-
16
-
17
-
18
-
19
-
20
-
21
-
22
-
23
-
24
-
25
-
26
-
27
-
28
-
29
-
30
-
31
-
32
-
33
-
34
-
35
-
36
-
37
-
38
-
39
-
40
-
41
-
42
-
43
-
44
-
45
-
46
-
47
-
48
-
49
-
50
-
51
-
52
-
53
-
54
-
55
-
56
-
57
-
58
-
59
-
60
-
61
-
62
-
63
-
64
-
65
-
66
-
67
-
68
-
69
-
70
-
71
-
72
-
73
-
74
-
75
-
76
-
 77
77 -
 78
78 -
 79
79 -
 80
80 -
 81
81 -
 82
82 -
 83
83 -
 84
84 -
 85
85 -
 86
86 -
 87
87 -
 88
88 -
 89
89 -
 90
90 -
 91
91 -
 92
92
 |
 |

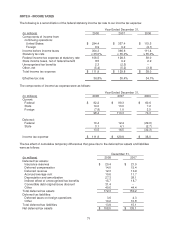
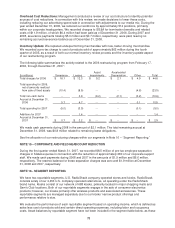
Product Sales Information: Our consolidated net sales and operating revenues are summarized by
groups of similar products and services, as follows:
Consolidated Net Sales and Operating Revenues
Year Ended December 31,
(In millions) 2008 2007 2006
W ireles s $ 1,393.8 33.0% $ 1,416.5 33.3% $ 1,654.8 34.6%
Accessory 1,183.9 28.0 1,029.7 24.2 1,087.6 22.8
Personal electronics 545.7 12.9 650.7 15.3 751.8 15.7
Modern home 527.1 12.5 556.2 13.1 612.1 12.8
Power 242.4 5.7 251.3 5.9 271.4 5.7
Technical 183.7 4.4 184.4 4.3 198.5 4.2
Service 95.8 2.3 100.5 2.4 106.3 2.2
Service centers and other
sales
52.1
1.2
62.4
1.5
95.0
2.0
Consolidated net sales and
operating revenues
$ 4,224.5
100.0%
$ 4,251.7
100.0%
$ 4,777.5
100.0%
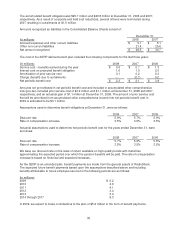
2006 Restructuring: The table below shows our 2006 restructuring program costs and impairments
allocated by reportable segments.
(In millions)
RadioShack
Company-
Owned Stores Kiosks Other Unallocated Total
Restructuring program:
Impairment of property, plant &
equipment $ 9.2 $ -- $ -- $ -- $ 9.2
Severance 3.8 -- 0.9 11.4 16.1
Lease costs 9.1 -- 1.2 2.0 12.3
Gain on distribution center sale -- -- -- (2.7) (2.7)
Other 6.1 -- 0.1 1.4 7.6
Accelerated depreciation 2.1 -- -- -- 2.1
30.3 -- 2.2 12.1 44.6
Impairments:
Goodwill -- 18.6 1.2 -- 19.8
Intangibles -- 10.7 -- -- 10.7
Property, plant & equipment 1.0 1.8 1.8 -- 4.6
1.0 31.1 3.0 -- 35.1
$ 31.3 $ 31.1 $ 5.2 $ 12.1 $ 79.7
The costs in this restructuring table are included in the 2006 segment table above.
80