Radio Shack 2008 Annual Report Download - page 32
Download and view the complete annual report
Please find page 32 of the 2008 Radio Shack annual report below. You can navigate through the pages in the report by either clicking on the pages listed below, or by using the keyword search tool below to find specific information within the annual report.-
 1
1 -
2
-
3
-
4
-
5
-
6
-
7
-
8
-
9
-
10
-
11
-
12
-
13
-
14
-
15
-
16
-
17
-
18
-
19
-
20
-
21
-
 22
22 -
 23
23 -
 24
24 -
 25
25 -
 26
26 -
 27
27 -
 28
28 -
 29
29 -
 30
30 -
 31
31 -
 32
32 -
 33
33 -
 34
34 -
 35
35 -
 36
36 -
 37
37 -
 38
38 -
 39
39 -
 40
40 -
 41
41 -
 42
42 -
43
-
44
-
45
-
46
-
47
-
48
-
49
-
50
-
51
-
52
-
53
-
54
-
55
-
56
-
57
-
58
-
59
-
60
-
61
-
62
-
63
-
64
-
65
-
66
-
67
-
68
-
69
-
70
-
71
-
72
-
73
-
74
-
75
-
76
-
77
-
78
-
79
-
80
-
81
-
82
-
83
-
84
-
85
-
86
-
87
-
88
-
89
-
90
-
91
-
92
 |
 |

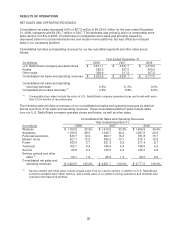
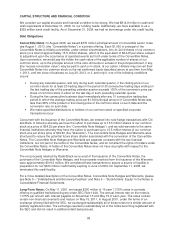
SELLING, GENERAL AND ADMINISTRATIVE (“SG&A”) EXPENSE
Our consolidated SG&A expense decreased 1.9% or $28.7 million in 2008. This represents a 50 basis
point decrease as a percentage of net sales and operating revenues compared to 2007.
The table below summarizes the breakdown of various components of our consolidated SG&A expense
and its related percentage of total net sales and operating revenues.
Year Ended December 31,
2008 2007 2006
% of % of % of
Sales & Sales & Sales &
(In millions) Dollars Revenues Dollars Revenues Dollars Revenues
Payroll and commissions $ 617.5 14.6% $ 638.6 15.0% $ 798.2 16.7%
Rent 300.9 7.1 304.7 7.2 312.1 6.5
Advertising 214.5 5.1 208.8 4.9 216.3 4.5
Other taxes (excludes
income taxes)
87.9
2.1
103.0
2.4
121.2
2.5
Utilities and telephone 58.7 1.4 61.4 1.4 64.7 1.4
Insurance 55.0 1.3 58.1 1.4 62.8 1.3
Credit card fees 37.7 0.9 37.8 0.9 40.1 0.8
Professional fees 26.3 0.6 19.1 0.4 49.2 1.0
Licenses 12.4 0.3 12.7 0.3 13.2 0.3
Repairs and maintenance 11.2 0.3 10.9 0.3 11.7 0.3
Printing, postage and office
supplies
8.1
0.2
9.6
0.2
11.7
0.3
Recruiting, training &
employee relations
6.9
0.2
6.8
0.2
12.3
0.3
Stock purchase and
savings plans 6.5 0.2 7.2 0.2 11.1 0.2
Travel 5.4 0.1 5.2 0.1 8.3 0.2
Warranty and product repair 4.2 0.1 5.1 0.1 7.1 0.1
Other 56.6 1.2 49.5 1.2 70.7 1.5
$ 1,509.8 35.7% $ 1,538.5 36.2% $ 1,810.7 37.9%
Payroll and commissions expense decreased in dollars and as a percentage of net sales and operating
revenues. This decrease was partially driven by lower incentive compensation paid to store and corporate
personnel and fewer employees in our kiosk operation, distribution centers, and at our corporate
headquarters. Additionally, in 2007 we reduced our accrued vacation liability by $14.3 million in connection
with the modification of our employee vacation policy and recorded an $8.5 million charge for employee
separation charges.
Rent expense decreased primarily due to lower rent expense associated with our corporate headquarters
for the second half of 2008. See below for further discussion.
The decrease in other taxes was partially driven by reduced payroll taxes associated with the decreased
compensation expense. Additionally, we recorded an $8.2 million sales and use tax benefit from the
settlement of a sales tax issue.
The increase in other SG&A was primarily due to a $12.1 million non-cash charge recorded in connection
with our amended headquarters lease. See below for further discussion.
Corporate Headquarters’ Amended Lease: In June 2008, Tarrant County College District (“TCC”)
announced that it had purchased from Kan Am Grund Kapitalanlagegesellschaft mbH (“Kan Am”) the
buildings and real property comprising our corporate headquarters in Fort Worth, Texas, which we had
previously sold to Kan Am and then leased for a period of 20 years in a sale and lease-back transaction in
December 2005.
25