Radio Shack 2008 Annual Report Download - page 35
Download and view the complete annual report
Please find page 35 of the 2008 Radio Shack annual report below. You can navigate through the pages in the report by either clicking on the pages listed below, or by using the keyword search tool below to find specific information within the annual report.-
 1
1 -
2
-
3
-
4
-
5
-
6
-
7
-
8
-
9
-
10
-
11
-
12
-
13
-
14
-
15
-
16
-
17
-
18
-
19
-
20
-
21
-
22
-
23
-
24
-
 25
25 -
 26
26 -
 27
27 -
 28
28 -
 29
29 -
 30
30 -
 31
31 -
 32
32 -
 33
33 -
 34
34 -
 35
35 -
 36
36 -
 37
37 -
 38
38 -
 39
39 -
 40
40 -
 41
41 -
 42
42 -
 43
43 -
 44
44 -
 45
45 -
46
-
47
-
48
-
49
-
50
-
51
-
52
-
53
-
54
-
55
-
56
-
57
-
58
-
59
-
60
-
61
-
62
-
63
-
64
-
65
-
66
-
67
-
68
-
69
-
70
-
71
-
72
-
73
-
74
-
75
-
76
-
77
-
78
-
79
-
80
-
81
-
82
-
83
-
84
-
85
-
86
-
87
-
88
-
89
-
90
-
91
-
92
 |
 |

summer of 2006, we also focused on our top-performing stores and completed the closure of 481
underperforming stores, reducing the number of retail employees in connection with these closures.
Additionally, we consolidated our distribution centers in the fall of 2006. Management also reduced our
cost structure, including our advertising spend rate and our workforce within our corporate headquarters.
A number of other cost reductions were implemented. As of December 31, 2006, we considered our
restructuring program to be substantially complete.
The 2006 restructuring affects comparability in certain areas of this MD&A discussion and is discussed
where necessary.
See “Financial Impact of Restructuring Program” below for a discussion of the financial impact of our 2006
restructuring program.
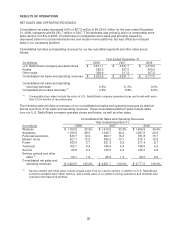
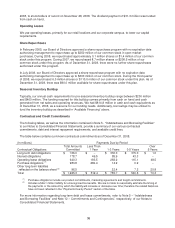
NET SALES AND OPERATING REVENUES
Consolidated net sales decreased 11.0% or $525.8 million to $4,251.7 million in 2007, from $4,777.5
million in 2006. This decrease was primarily due to a comparable store sales decline of 8.2% in addition to
the closure of 481 U.S. RadioShack company-operated stores during June and July 2006 as part of our
2006 restructuring. Approximately 290 of the 481 stores were closed in July 2006, with a majority of the
remainder closed in the last half of June 2006. The decrease in comparable store sales was primarily
caused by a decline in our wireless and personal electronics platform sales.
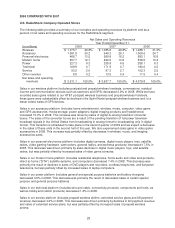
U.S. RadioShack Company-Operated Stores
To assist in comparability, the revenue discussion presented below primarily analyzes results excluding
the stores closed in 2006.
Excluding the effects of the 2006 store closures, sales in our wireless platform decreased 13.7% in 2007.
This decrease was primarily driven by a decline in postpaid wireless sales for our two main wireless
carriers. We believe that these sales declines were the result of increased wireless competition, a
challenging wireless industry environment, and a shift to prepaid handsets and corresponding service
plans. This decrease, however, was partially offset by increased sales of GPS products, particularly in the
fourth quarter of 2007, and prepaid wireless handset sales. Including the effects of the 2006 store
closures, wireless platform sales decreased 15.7%.
Excluding the effects of the 2006 store closures, sales in our accessory platform decreased 2.3% in 2007.
This decrease was primarily the result of declines in wireless and home entertainment accessory sales,
but partially offset by increases in media storage and imaging accessories sales. Including the effects of
the 2006 store closures, accessory platform sales decreased 5.7%.
Excluding the effects of the 2006 store closures, sales in our personal electronics platform decreased
11.7% in 2007. This decrease was driven primarily by sales declines in satellite radios and digital music
players, but was partially offset by increased sales of video gaming products. Including the effects of the
2006 store closures, personal electronics platform sales decreased 13.7%.
Excluding the effects of the 2006 store closures, sales in our modern home platform decreased 5.7% in
2007. This decrease was the result of sales declines in residential telephones, and DVD players and
recorders, offset by increased sales of laptop computers, PC peripherals, and flash drives. Including the
effects of the 2006 store closures, modern home platform sales decreased 8.3%.
Excluding the effects of the 2006 store closures, sales in our power platform decreased 5.6% in 2007.
This sales decline was the result of decreased sales of general purpose and special purpose telephone
batteries. Including the effects of the 2006 store closures, power platform sales decreased 8.6%.
Excluding the effects of the 2006 store closures, sales in our technical platform decreased 2.2% in 2007.
This sales decline was due primarily to a decrease in sales of robotic kits, metal detectors and tools,
partially offset by an increase in audio cable sales. Including the effects of the 2006 store closures,
technical platform sales decreased 6.9%.
28