Radio Shack 2008 Annual Report Download - page 30
Download and view the complete annual report
Please find page 30 of the 2008 Radio Shack annual report below. You can navigate through the pages in the report by either clicking on the pages listed below, or by using the keyword search tool below to find specific information within the annual report.-
 1
1 -
2
-
3
-
4
-
5
-
6
-
7
-
8
-
9
-
10
-
11
-
12
-
13
-
14
-
15
-
16
-
17
-
18
-
19
-
 20
20 -
 21
21 -
 22
22 -
 23
23 -
 24
24 -
 25
25 -
 26
26 -
 27
27 -
 28
28 -
 29
29 -
 30
30 -
 31
31 -
 32
32 -
 33
33 -
 34
34 -
 35
35 -
 36
36 -
 37
37 -
 38
38 -
 39
39 -
 40
40 -
41
-
42
-
43
-
44
-
45
-
46
-
47
-
48
-
49
-
50
-
51
-
52
-
53
-
54
-
55
-
56
-
57
-
58
-
59
-
60
-
61
-
62
-
63
-
64
-
65
-
66
-
67
-
68
-
69
-
70
-
71
-
72
-
73
-
74
-
75
-
76
-
77
-
78
-
79
-
80
-
81
-
82
-
83
-
84
-
85
-
86
-
87
-
88
-
89
-
90
-
91
-
92
 |
 |

2008 COMPARED WITH 2007
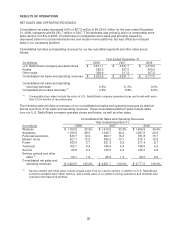
U.S. RadioShack Company-Operated Stores
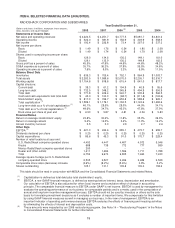
The following table provides a summary of our net sales and operating revenues by platform and as a
percent of net sales and operating revenues for the RadioShack segment.
Net Sales and Operating Revenues
Year Ended December 31,
(In millions) 2008 2007 2006
Wireless $ 1,075.7 29.8% $ 1,085.6 29.8% $ 1,288.1 31.6%
Accessory 1,091.8 30.2 949.3 26.1 1,006.6 24.7
Personal electronics 486.7 13.5 589.8 16.2 683.1 16.8
Modern home 457.7 12.7 494.5 13.6 539.5 13.2
Power 227.3 6.3 235.8 6.5 258.1 6.3
Technical 169.9 4.7 171.9 4.7 184.6 4.5
Service 93.2 2.6 97.3 2.7 102.3 2.5
Other revenue 8.8 0.2 13.5 0.4 17.5 0.4
Net sales and operating
revenues
$ 3,611.1
100.0%
$ 3,637.7
100.0%
$ 4,079.8
100.0%
Sales in our wireless platform (includes postpaid and prepaid wireless handsets, commissions, residual
income and communication devices such as scanners and GPS) decreased 0.9% in 2008. While we have
recorded sales gains related to our AT&T postpaid wireless business and prepaid wireless handsets,
these gains were substantially offset by declines in the Sprint Nextel postpaid wireless business and, to a
lesser extent, sales of GPS devices.
Sales in our accessory platform (includes home entertainment, wireless, music, computer, video game
and GPS accessories; media storage; power adapters; digital imaging products and headphones)
increased 15.0% in 2008. This increase was driven by sales of digital-to-analog television converter
boxes. The sales of the converter boxes are a result of the pending transition of full-power television
broadcast signals in the United States from broadcasting in analog format to broadcasting only in digital
format. This transition is scheduled to take place in the second quarter of 2009 and we expect a decrease
in the sales of these units in the second half of the year. We also experienced sales gains in video game
accessories in 2008. This increase was partially offset by decreases in wireless, music, and imaging
accessories sales.
Sales in our personal electronics platform (includes digital cameras, digital music players, toys, satellite
radios, video gaming hardware, camcorders, general radios, and wellness products) decreased 17.5% in
2008. This decrease was driven primarily by sales declines in digital music players, toys, and satellite
radios, but was partially offset by increased sales of video game consoles.
Sales in our modern home platform (includes residential telephones, home audio and video end-products,
direct-to-home (“DTH”) satellite systems, and computers) decreased 7.4% in 2008. This decrease was
primarily the result of declines in sales of DVD players and recorders, cordless telephones, and flat panel
televisions, but was partially offset by increased sales of laptop computers.
Sales in our power platform (includes general and special purpose batteries and battery chargers)
decreased 3.6% in 2008. This decrease was primarily the result of decreased sales of certain special
purpose and general purpose batteries.
Sales in our technical platform (includes wire and cable, connectivity products, components and tools, as
well as hobby and robotic products) decreased 1.2% in 2008.
Sales in our service platform (includes prepaid wireless airtime, extended service plans and bill payment
revenue) decreased 4.2% in 2008. This decrease was driven primarily by declines in bill payment revenue
and sales of extended service plans, but was partially offset by increased sales of prepaid wireless
airtime.
23