Radio Shack 2004 Annual Report Download - page 55
Download and view the complete annual report
Please find page 55 of the 2004 Radio Shack annual report below. You can navigate through the pages in the report by either clicking on the pages listed below, or by using the keyword search tool below to find specific information within the annual report.-
 1
1 -
2
-
3
-
4
-
5
-
6
-
7
-
8
-
9
-
10
-
11
-
12
-
13
-
14
-
15
-
16
-
17
-
18
-
19
-
20
-
21
-
22
-
23
-
24
-
25
-
26
-
27
-
28
-
29
-
30
-
31
-
32
-
33
-
34
-
35
-
36
-
37
-
38
-
39
-
40
-
41
-
42
-
43
-
44
-
 45
45 -
 46
46 -
 47
47 -
 48
48 -
 49
49 -
 50
50 -
 51
51 -
 52
52 -
 53
53 -
 54
54 -
 55
55 -
 56
56 -
 57
57 -
 58
58 -
 59
59 -
 60
60
 |
 |

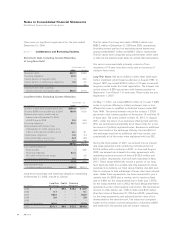
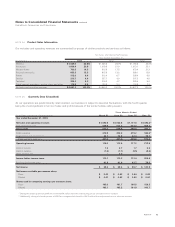
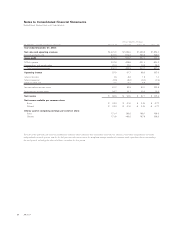
NOTE 24 Product Sales Information
Our net sales and operating revenues are summarized by groups of similar products and services as follows:
Net Sales and Operating Revenues
Year Ended December 31,
(In millions) 2004 2003 2002
Wireless $1,636.0 33.8% $ 1,335.8 28.7% $ 1,164.8 25.4%
Accessory 1,009.4 20.8 1,018.9 21.9 1,013.1 22.1
Modern home 700.3 14.5 812.9 17.5 973.4 21.3
Personal electronics 653.3 13.5 615.9 13.2 588.1 12.9
Power 312.0 6.4 312.4 6.7 296.4 6.5
Service 210.7 4.4 227.7 4.9 207.2 4.5
Technical 204.2 4.2 216.2 4.7 229.4 5.0
Retail support operations, service plans, and other 115.3 2.4 109.5 2.4 104.8 2.3
Net sales and operating revenues $4,841.2 100.0% $ 4,649.3 100.0% $ 4,577.2 100.0%
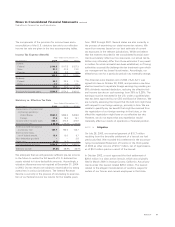
NOTE 25 Quarterly Data (Unaudited)
As our operations are predominantly retail oriented, our business is subject to seasonal fluctuations, with the fourth quarter
being the most significant in terms of sales and profits because of the winter holiday selling season.
Three Months Ended
(In millions, except per share amounts) March 31 June 30 Sept. 30 Dec. 31
Year ended December 31, 2004:
Net sales and operating revenues $ 1,092.6 $1,053.8 $1,101.5 $1,593.3(1)
Cost of products sold 539.6 514.2 544.7 808.2
Gross profit 553.0 539.6 556.8 785.1
SG&A expense 412.9 402.2 415.2 544.5(2)
Depreciation and amortization 24.1 24.8 24.4 28.1
Total operating expenses 437.0 427.0 439.6 572.6
Operating income 116.0 112.6 117.2 212.5
Interest income 1.5 2.7 1.7 5.5
Interest expense (7.4) (7.1) (6.5) (8.6)
Other income, net – 2.0 – –
Income before income taxes 110.1 110.2 112.4 209.4
Provision for income taxes 41.8 41.9 42.7 78.5
Net income $ 68.3 $ 68.3 $ 69.7 $ 130.9
Net income available per common share:
Basic $ 0.42 $ 0.42 $ 0.44 $ 0.82
Diluted $ 0.41 $ 0.42 $ 0.43 $ 0.81
Shares used in computing earnings per common share:
Basic 163.0 161.7 160.0 159.3
Diluted 165.1 163.2 161.0 160.7
(1) During the fourth quarter of 2004 we received $8.4 million from the restructuring of our extended service contract.
(2) Additionally, during the fourth quarter of 2004 we recognized the benefit of $6.5 million from adjustments to our sales tax reserves.
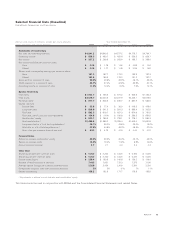
Notes to Consolidated Financial Statements continued
RadioShack Corporation and Subsidiaries
53
AR2004