Radio Shack 2004 Annual Report Download - page 42
Download and view the complete annual report
Please find page 42 of the 2004 Radio Shack annual report below. You can navigate through the pages in the report by either clicking on the pages listed below, or by using the keyword search tool below to find specific information within the annual report.-
 1
1 -
2
-
3
-
4
-
5
-
6
-
7
-
8
-
9
-
10
-
11
-
12
-
13
-
14
-
15
-
16
-
17
-
18
-
19
-
20
-
21
-
22
-
23
-
24
-
25
-
26
-
27
-
28
-
29
-
30
-
31
-
 32
32 -
 33
33 -
 34
34 -
 35
35 -
 36
36 -
 37
37 -
 38
38 -
 39
39 -
 40
40 -
 41
41 -
 42
42 -
 43
43 -
 44
44 -
 45
45 -
 46
46 -
 47
47 -
 48
48 -
 49
49 -
 50
50 -
 51
51 -
 52
52 -
53
-
54
-
55
-
56
-
57
-
58
-
59
-
60
 |
 |
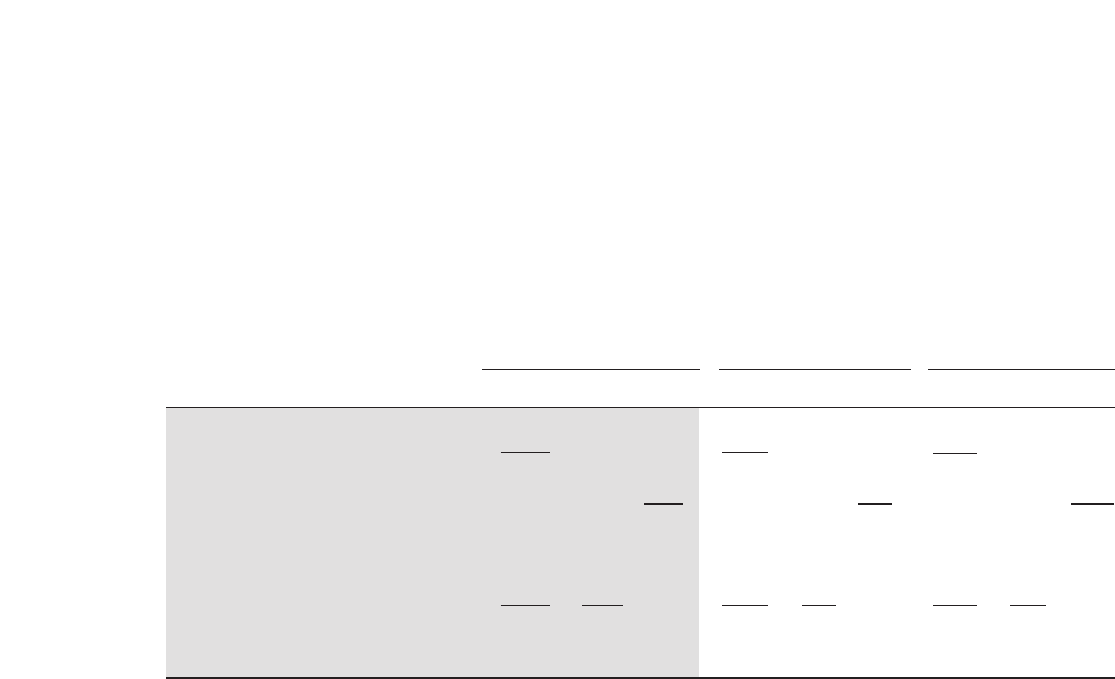
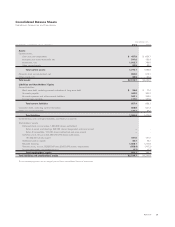
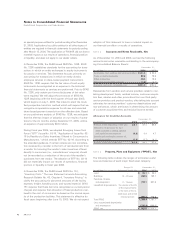
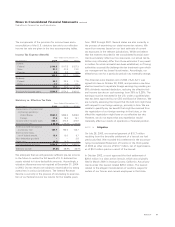
The following table reconciles the numerator and denominator used in the basic and diluted earnings per share calculations.
Year Ended December 31,
2004 2003 2002
Income Shares Per Share Income Shares Per Share Income Shares Per Share
(In millions, except per share amounts) (Numerator) (Denominator) Amount (Numerator) (Denominator) Amount (Numerator) (Denominator) Amount
Net income $337.2 $298.5 $263.4
Less: Preferred stock dividends –– (4.5)
Basic EPS
Net income available to common stockholders 337.2 161.0 $2.09 298.5 167.7 $1.78 258.9 173.0 $1.50
Effect of dilutive securities:
Plus dividends on Series B preferred stock –– 4.5
Additional contribution required if preferred
stock had been converted –– – – (3.3) 5.3
Stock options 1.5 1.2 1.0
Diluted EPS
Net income available to common stockholders
plus assumed conversions $337.2 162.5 $2.08 $298.5 168.9 $1.77 $260.1 179.3 $1.45
Inventories: Our inventories are stated at the lower of cost
(principally based on average cost) or market value and are
comprised primarily of finished goods.
Property, Plant and Equipment: We state our property, plant
and equipment at cost, less accumulated depreciation and
amortization. For financial reporting purposes, depreciation
and amortization are primarily calculated using the straight-
line method, which amortizes the cost of the assets over their
estimated useful lives. When we sell or retire depreciable
assets, we remove the related cost and accumulated depreci-
ation from our accounts and we recognize gains and losses.
Major additions and betterments are capitalized. Maintenance
and repairs which do not materially improve or extend the
lives of the respective assets are charged to operations as we
incur these expenses.
Capitalized Software Costs: We capitalize qualifying costs
related to developing internal-use software. Capitalization of
costs begins after the conceptual formulation stage has been
completed. Capitalized costs are amortized over the estimated
useful life of the software, which ranges between three and
five years. Capitalized software costs at December 31, 2004,
2003 and 2002, totaled $42.6 million, $37.9 million and $43.8
million, net of accumulated amortization of $65.8 million,
$53.3 million and $39.0 million, respectively.
Impairment of Long-Lived Assets: We review long-lived assets
(primarily property, plant and equipment, goodwill and intan-
gibles) held and used by us or to be disposed of for impair-
Options to purchase 10.9 million, 16.8 million and 18.1 million
shares of common stock in 2004, 2003 and 2002, respectively,
were not included in the computation of diluted earnings per
common share because the option exercise price was greater
than the average market price of the common stock during the
year and the effect of their inclusion would be anti-dilutive.
Cash and Cash Equivalents: Cash on hand in stores, deposits
in banks and all highly liquid investments with an original or
remaining maturity of three months or less at the time of pur-
chase are considered cash and cash equivalents. We carry
our cash equivalents at cost, which approximates fair value
because of the short maturity of the instruments. The weight-
ed average interest rates were 2.2% and 1.0% at December
31, 2004 and 2003, respectively, for cash equivalents totaling
$386.2 million and $566.4 million, respectively.
Accounts Receivable and Allowance for Doubtful Accounts:
Concentrations of credit risk with respect to customer and
dealer receivables are limited due to the large number of cus-
tomers, dealers and their location in many different geographic
areas of the country. However, we do have some concentra-
tion of credit risk from service providers in the wireless tele-
phone industry, due to sales of their products and services.
We establish an allowance for doubtful accounts based on fac-
tors surrounding the credit risk of specific customers, histori-
cal trends and other information and, historically, such losses,
in the aggregate, have not exceeded our expectations.
Account balances are charged against the allowance when we
believe it is probable that the receivable will not be recovered.
Notes to Consolidated Financial Statements
RadioShack Corporation and Subsidiaries
40 AR2004