Radio Shack 2004 Annual Report Download - page 25
Download and view the complete annual report
Please find page 25 of the 2004 Radio Shack annual report below. You can navigate through the pages in the report by either clicking on the pages listed below, or by using the keyword search tool below to find specific information within the annual report.-
 1
1 -
2
-
3
-
4
-
5
-
6
-
7
-
8
-
9
-
10
-
11
-
12
-
13
-
14
-
 15
15 -
 16
16 -
 17
17 -
 18
18 -
 19
19 -
 20
20 -
 21
21 -
 22
22 -
 23
23 -
 24
24 -
 25
25 -
 26
26 -
 27
27 -
 28
28 -
 29
29 -
 30
30 -
 31
31 -
 32
32 -
 33
33 -
 34
34 -
 35
35 -
36
-
37
-
38
-
39
-
40
-
41
-
42
-
43
-
44
-
45
-
46
-
47
-
48
-
49
-
50
-
51
-
52
-
53
-
54
-
55
-
56
-
57
-
58
-
59
-
60
 |
 |

2003 COMPARED WITH 2002
Net Sales and Operating Revenues
Sales increased approximately 1.6% to $4,649.3 million in 2003
from $4,577.2 million in 2002. We had a 2% increase in com-
parable company store sales. These sales increases were possi-
ble because of an increase in average store volume, despite a
decrease in 2003 of 40 company stores, net of store openings.
Sales to our dealer outlets and other sales, including retail
support operations, were down for 2003, when compared to
2002. Sales to our dealer outlets remained substantially less
than 10% of our total sales. Retail support operation sales
were generated primarily from outside sales of our repair
centers, AmeriLink, and domestic and overseas manufactur-
ing. The decrease in retail support operations sales from 2003
to 2002 was primarily the result of an overall decline in our
AmeriLink commercial installation business, the closure of
several of our manufacturing facilities in the third quarter of
2003, and the sale of AmeriLink in September 2003.
Sales in our wireless platform increased in dollars and as a
percentage of net sales and operating revenues in 2003,
compared to 2002. This sales increase was due primarily to
an increase in the average selling price of our wireless hand-
sets as a result of our continued emphasis on national carrier
service and product offerings with desirable product features
and content, such as color screens and cameras.
Sales in our accessory platform increased in dollars, but
decreased as a percentage of net sales and operating rev-
enues in 2003, compared to 2002. The dollar increase in this
platform was primarily the result of increases in both wire-
less power and imaging accessories sales, but partially off-
set by a decline in sales of residential telephone and home
entertainment accessories.
Sales in our modern home platform decreased in both dollars
and as a percentage of net sales and operating revenues in
2003, compared to 2002. These decreases were primarily due
to decreased sales of satellite dishes and their related installa-
tion services, in addition to desktop CPUs and monitors.
Sales in our personal electronics platform increased in dollars
and as a percentage of net sales and operating revenues in
2003, compared to 2002. These increases were driven primari-
ly by sales increases in digital cameras and camcorders, micro
radio-controlled cars and, to a lesser extent, wellness products
sold under our LifewiseTM brand. This sales increase was
partially offset by decreased sales of educational toys.
Sales in our power platform increased in both dollars and
as a percentage of net sales and operating revenues in 2003,
compared to 2002. This sales gain was primarily due to
increased sales of general and special purpose batteries.
Sales in our service platform increased in dollars and as a
percentage of net sales and operating revenues in 2003,
compared to 2002. These increases were primarily due to
an increase in our wireless services sales.
Sales in our technical platform decreased in both dollars and
as a percentage of net sales and operating revenues in 2003,
compared to 2002. These decreases were primarily due to a
decline in sales of bulk and packaged wire, as well as sales
decreases for technical components and hobby products.
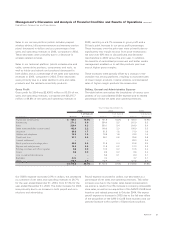
Gross Profit
Gross profit for 2003 was $2,315.7 million or 49.8% of net
sales and operating revenues, compared with $2,238.3 million
or 48.9% of net sales and operating revenues in 2002, result-
ing in a 3.5% increase in gross profit and a 90 basis point
increase in our gross profit percentage. These increases over
the prior year were primarily due to the following:
We experienced over $40.0 million in benefit from our supply
chain vendor and strategic pricing initiatives. In connection with
these initiatives, we utilized online reverse auctions, realized
more favorable terms from vendors, improved the impact of
markdowns, priced our products more appropriately, and uti-
lized other techniques and incentives to optimize gross profit.
We also improved our merchandise mix within platforms
by increasing the sales mix for many of our higher margin
products, while managing the mix down for many lower
margin products.
Selling, General and Administrative Expense
Our SG&A expense increased 0.7% in dollars, but decreased
as a percent of net sales and operating revenues to 37.4% for
the year ended December 31, 2003, from 37.8% for the year
ended December 31, 2002. The dollar increase for 2003 was
primarily due to an increase in both payroll and commissions
and advertising, partially offset by a litigation charge in 2002
related to the settlement of a class action lawsuit in California.
Payroll expense increased in both dollars and as a percentage
of net sales and operating revenues in 2003, due primarily to
an increase in incentive pay based on increased earnings, as
well as the 2.6% increase in company store sales.
Management’s Discussion and Analysis of Financial Condition and Results of Operations continued
RadioShack Corporation and Subsidiaries
23
AR2004