Radio Shack 2004 Annual Report Download - page 21
Download and view the complete annual report
Please find page 21 of the 2004 Radio Shack annual report below. You can navigate through the pages in the report by either clicking on the pages listed below, or by using the keyword search tool below to find specific information within the annual report.-
 1
1 -
2
-
3
-
4
-
5
-
6
-
7
-
8
-
9
-
10
-
 11
11 -
 12
12 -
 13
13 -
 14
14 -
 15
15 -
 16
16 -
 17
17 -
 18
18 -
 19
19 -
 20
20 -
 21
21 -
 22
22 -
 23
23 -
 24
24 -
 25
25 -
 26
26 -
 27
27 -
 28
28 -
 29
29 -
 30
30 -
 31
31 -
32
-
33
-
34
-
35
-
36
-
37
-
38
-
39
-
40
-
41
-
42
-
43
-
44
-
45
-
46
-
47
-
48
-
49
-
50
-
51
-
52
-
53
-
54
-
55
-
56
-
57
-
58
-
59
-
60
 |
 |

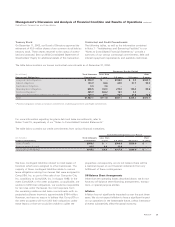
The change in net sales and operating revenue provides us
with an overall indication of the demand for our products and
services. Comparable company store sales growth indicates
the extent to which sales were impacted by growth in existing
sales channels. Comparable company store sales include the
sales of any domestic, retail location where we have a physi-
cal presence, including company-operated stores and kiosks,
that has more than 12 full months of recorded sales. Average
tickets per store, in conjunction with average sales per ticket,
provide us with an indication of whether the changes in rev-
enues were generated by a higher volume of purchases or
by purchases of products with higher prices.
The table below summarizes these revenue metrics for the
years indicated:
2004 2003 2002
Net sales and operating
revenues growth 4.1% 1.6% (4.2%)
Comparable store sales growth 3% 2% (1%)
Average tickets per store per day 66 72 73
Average sales per ticket $34.17 $30.77 $ 29.40
In addition to the metrics above, we review the revenue per
square foot of our various channels of distribution to deter-
mine productivity of our product assortment and the overall
distribution channel.
Gross Margin Metrics
We also view our gross margin as a key metric of our finan-
cial performance, as it indicates the extent to which we are
able to reduce our product costs and optimize product mix.
The table below summarizes gross margin for the
years indicated:
2004 2003 2002
Gross margin 50.3% 49.8% 48.9%
SG&A Expense and Operating Margin Metrics
We believe that our ability to leverage our fixed expense base
and, accordingly, increase operating margin is an important
indicator of our financial performance and process efficiency.
The table below summarizes these metrics for the
years indicated:
2004 2003 2002
SG&A expense as a percentage of sales 36.7% 37.4% 37.8%
Operating margin 11.5% 10.4% 9.3%
Retail Outlets
The table below shows our retail locations broken down
between company-operated stores, kiosks and dealer outlets.
While the dealer outlets represented approximately 24% of
RadioShack’s total retail locations at December 31, 2004, our
product sales to dealers are less than 10% of our total net sales
and operating revenues (see “Results of Operations” below).
Average
Store Size At December 31,
(Sq. Ft.) 2004 2003 2002
Company-operated stores (1) 2,529 5,046 5,121 5,161
Kiosks (2) 89 599 9–
Dealer outlets (3) N/A 1,788 1,921 2,052
Total number of retail locations 7,433 7,051 7,213
(1) Over the past two years, we have closed over 100 company-operated
stores, net of new store openings and relocations. This trend is due to not
renewing locations that fail to meet our financial return hurdles. It is antici-
pated that company-operated stores will decline in 2005 by about 50 stores.
(2) Kiosks consist of 546 SAM’S CLUB locations and 53 Sprint locations at the
end of 2004 and 9 Sprint locations at year end 2003. SAM’S CLUB has the
unconditional right to assume the operation of up to 75 locations (in total)
and to date has provided us with notice that, effective April 2005, SAM’S
CLUB will assume operation of 23 kiosk locations previously operated by
us. We expect the number of Sprint kiosks to increase by approximately
150 during 2005.
(3) Over the past two years, we have closed over 250 dealer outlets, net of
new outlet openings or conversion to company-operated stores. This trend
is due to the closure of smaller outlets that failed to meet our minimum
purchase requirements. It is anticipated that dealer outlets in 2005 will
not change materially from 2004.
Results of Operations
Net sales and operating revenues by channel of distribution
are as follows:
Year Ended December 31,
(In millions) 2004 2003 2002
Company-operated store sales $4,472.3 $4,342.6 $ 4,231.2
Kiosk sales 56.4 0.7 –
Dealer and other sales 312.5 306.0 346.0
Net sales and operating revenues $4,841.2 $4,649.3 $ 4,577.2
Dealer and other sales not only include our sales to the
independent dealers, but also include sales and operating
revenues generated from our www.radioshack.com Web
site, outbound and inbound call centers, and our retail
support operations.
Management’s Discussion and Analysis of Financial Condition and Results of Operations continued
RadioShack Corporation and Subsidiaries
19
AR2004