Radio Shack 2004 Annual Report Download - page 23
Download and view the complete annual report
Please find page 23 of the 2004 Radio Shack annual report below. You can navigate through the pages in the report by either clicking on the pages listed below, or by using the keyword search tool below to find specific information within the annual report.
Management’s Discussion and Analysis of Financial Condition and Results of Operations continued
RadioShack Corporation and Subsidiaries
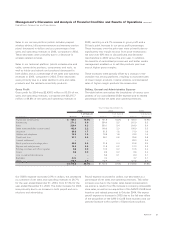
Year Ended December 31,
2004 2003 2002
% of Sales & % of Sales & % of Sales &
(In millions) Dollars Revenues Dollars Revenues Dollars Revenues
Payroll and commissions $ 769.3 15.9% $ 751.9 16.2% $ 728.0 15.9%
Advertising 271.5 5.6 254.4 5.5 241.0 5.3
Rent 259.4 5.3 250.1 5.4 244.9 5.4
Other taxes (excludes income taxes) 105.9 2.2 106.9 2.3 105.9 2.3
Insurance 80.8 1.7 81.5 1.8 71.0 1.6
Utilities and telephone 72.9 1.5 75.8 1.6 74.9 1.6
Credit card fees 37.7 0.8 36.1 0.8 35.8 0.8
Lawsuit settlement –– – – 29.0 0.6
Stock purchase and savings plans 20.2 0.4 21.5 0.4 20.8 0.5
Repairs and maintenance 12.4 0.3 11.6 0.2 12.0 0.3
Printing, postage and office supplies 9.6 0.2 10.0 0.2 10.5 0.2
Travel 9.6 0.2 8.6 0.2 9.6 0.2
Loss on real estate sub-lease –– 5.6 0.1 6.0 0.1
Bad debt (0.3) – 0.4 – 4.7 0.1
Other 125.8 2.6 125.6 2.7 134.5 2.9
$1,774.8 36.7% $1,740.0 37.4% $1,728.6 37.8%
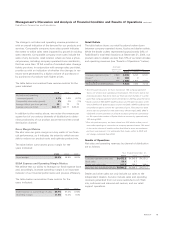
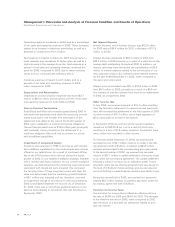
Sales in our service platform (which includes prepaid
wireless airtime, bill payment revenue and warranty service
plans) decreased in dollars and as a percentage of net
sales and operating revenues in 2004, compared to 2003.
These decreases were primarily due to a decrease in
wireless-related services.
Sales in our technical platform (which includes wire and
cable, connectivity products, components and tools, as
well as hobby and robotic end-products) decreased in
both dollars and as a percentage of net sales and operating
revenues in 2004, compared to 2003. These decreases
were primarily due to a sales decline in wire and cable
products and the related connectivity products.
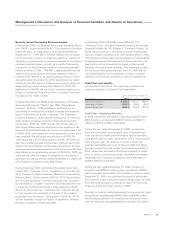
Gross Profit
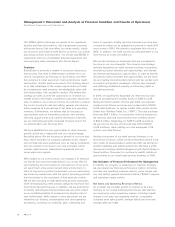
Gross profit for 2004 was $2,434.5 million or 50.3% of net
sales and operating revenues, compared with $2,315.7
million or 49.8% of net sales and operating revenues in
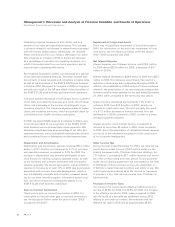
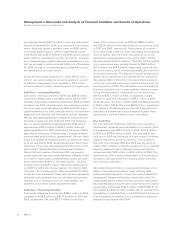
Our SG&A expense increased 2.0% in dollars, but decreased
as a percent of net sales and operating revenues to 36.7%
for the year ended December 31, 2004, from 37.4% for the
year ended December 31, 2003. The dollar increase for 2004
was primarily due to an increase in both payroll and com-
missions and advertising.
Payroll expense increased in dollars, but decreased as a
percentage of net sales and operating revenues. This dollar
increase was due to the higher sales-based compensation
we paid as a result of our 3% increase in company comparable
store sales, as well as our acquisition of the SAM’S CLUB kiosk
locations and related personnel in October 2004. We expect
payroll expense to increase in 2005 due to the full-year effect
of the acquisition of the SAM’S CLUB kiosk business and our
planned increase in the number of Sprint kiosk locations.
2003, resulting in a 5.1% increase in gross profit and a
50 basis point increase in our gross profit percentage.
These increases over the prior year were primarily due to
significantly less margin erosion from price markdowns;
we sold over 40% less in discontinued and devalued
merchandise in 2004 versus the prior year. In addition,
the benefits of centralized procurement and better vendor
management enabled us to sell like-products year over
year at higher gross margins.
These increases were partially offset by a change in mer-
chandise mix among platforms, resulting in increased sales
of lower margin products, notably wireless, and decreased
sales of higher margin products like accessories.
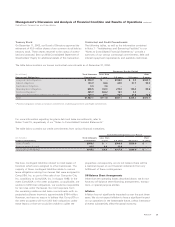
Selling, General and Administrative Expense
The table below summarizes the breakdown of various com-
ponents of our consolidated SG&A expense and its related
percentage of total net sales and operating revenues.
21
AR2004


