Radio Shack 2004 Annual Report Download - page 28
Download and view the complete annual report
Please find page 28 of the 2004 Radio Shack annual report below. You can navigate through the pages in the report by either clicking on the pages listed below, or by using the keyword search tool below to find specific information within the annual report.-
 1
1 -
2
-
3
-
4
-
5
-
6
-
7
-
8
-
9
-
10
-
11
-
12
-
13
-
14
-
15
-
16
-
17
-
 18
18 -
 19
19 -
 20
20 -
 21
21 -
 22
22 -
 23
23 -
 24
24 -
 25
25 -
 26
26 -
 27
27 -
 28
28 -
 29
29 -
 30
30 -
 31
31 -
 32
32 -
 33
33 -
 34
34 -
 35
35 -
 36
36 -
 37
37 -
 38
38 -
39
-
40
-
41
-
42
-
43
-
44
-
45
-
46
-
47
-
48
-
49
-
50
-
51
-
52
-
53
-
54
-
55
-
56
-
57
-
58
-
59
-
60
 |
 |

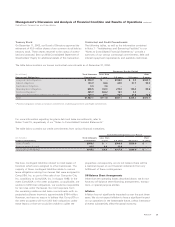
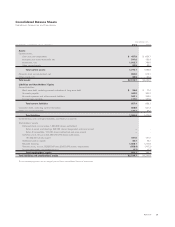
ing revenues. We had $437.9 million in cash and cash equiva-
lents as of December 31, 2004, as a resource for our funding
needs. Additional capital is available under our $600 million
commercial paper program, which is supported by a bank
credit facility that could be utilized in the event the commercial
paper market is unavailable to us. We currently do not expect
the commercial paper market to become unavailable to us nor
that; we will need to utilize our credit facility. As of December
31, 2004, we had no commercial paper outstanding, nor had
we utilized any of our credit facility.
During the year ended December 31, 2004, $161.8 million
more in cash was provided by accounts payable as a result
of effective management of our payables in 2004 and an
increase in inventory levels, when compared to the prior year.
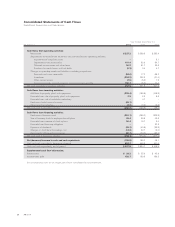
Cash Flow – Investing Activities
Cash used in investing activities in 2004 was $290.2 million,
compared to $188.9 million and $99.0 million used in 2003
and 2002, respectively. Capital expenditures for 2004 and 2003
increased over 2002, primarily due to the continued construc-
tion of our new corporate campus in 2004 and 2003, while
capital expenditures for 2002 were primarily for our retail store
expansions and remodels and information systems upgrades.
We also had capital expenditures relating to retail stores and
information systems in both 2004 and 2003. We anticipate
that our capital expenditure requirements for 2005 will be
approximately $200.0 million to $240.0 million. Although
capital expenditures for 2005 will be about the same as 2004,
expenditures will occur in different areas. Company-operated
store remodels and relocations, approximately 150 new Sprint
kiosks and updated information systems account for the major-
ity of our anticipated 2005 capital expenditures. See further
discussion on our new corporate headquarters below in the
section titled “Capital Structure and Financial Condition.”
During the fourth quarter of fiscal year 2004, we acquired
certain assets and assumed certain liabilities of Wireless Retail,
Inc. (“WRI”). These assets included wireless kiosks and inven-
tory located within SAM’S CLUB retail locations. The total
purchase price was $59.1 million. See further discussion on
our SAM’S CLUB kiosk business above in the section titled
“Overview.” As of December 31, 2004, we had $437.9 million
in cash and cash equivalents. These cash and cash equivalents,
along with cash generated from our net sales and operating
revenues and, if necessary, from our credit facilities, are
available to fund future capital expenditure needs.
Cash Flow – Financing Activities
Cash used in financing activities was $259.1 million in 2004,
compared to $274.8 million and $377.5 million in 2003 and
2002, respectively. We used $251.1 million for the repur-
chase of our common stock in 2004 and $286.2 million
and $329.9 million for the repurchase of our common stock
in 2003 and 2002, respectively. Repurchases of common
stock were made under our share repurchase and employee
stock programs. See the further discussion of our stock
repurchase programs below in the section titled “Capital
Structure and Financial Condition.” The 2004, 2003 and 2002
stock repurchases were partially funded by $85.8 million,
$51.5 million and $49.6 million, respectively, received from
the sale of treasury stock to employee benefit plans and from
stock option exercises. The balance of capital to repurchase
shares was obtained from cash generated from operations.
We received $32.3 million from the sale and lease-back of
our former corporate technology center building during the
second quarter of 2002. This transaction was recorded as a
financing obligation due to responsibilities which we retain
during the lease period. Additionally, our net borrowings
decreased $54.1 million in 2004, compared to a slight
increase in 2003 and a decrease of $89.7 million in 2002.
Dividends paid, net of tax, in 2004, 2003 and 2002 amounted
to $39.7 million, $40.8 million and $39.8 million, respectively.
This change in dividends paid over the last three years was
affected by a dividend per share increase and yearly share
repurchases, resulting in fewer shares outstanding.
Free Cash Flow
Our free cash flow, defined as cash flows from operating
activities less dividends paid and additions to property, plant
and equipment, was $83.4 million in 2004, $421.5 million
in 2003 and $375.0 million in 2002. The decrease in free
cash flow in 2004 was the result of a cash usage in working
capital components, primarily inventory. The increase in
free cash flow between 2002 and 2003 was the result of
supply chain initiatives, including a greater focus on reducing
inventory weeks-of-supply. We expect free cash flow to
be approximately $200 million to $240 million in 2005. The
increase from 2004 is based substantially on the anticipated
increase in cash generated from working capital, primarily
from inventory reductions.
We believe free cash flow is an appropriate indication of our
ability to fund share repurchases, repay maturing debt,
change dividend payments or fund other uses of capital that
management believes will enhance shareholder value. The
comparable financial measure to free cash flow under gener-
ally accepted accounting principles is cash flows from operat-
ing activities, which were $352.5 million in 2004, $651.9 mil-
lion in 2003 and $521.6 million in 2002. We do not intend the
presentation of free cash flow, a non-GAAP financial measure,
to be considered in isolation or as a substitute for measures
prepared in accordance with GAAP.
Management’s Discussion and Analysis of Financial Condition and Results of Operations
RadioShack Corporation and Subsidiaries
26 AR2004