Radio Shack 2004 Annual Report Download - page 22
Download and view the complete annual report
Please find page 22 of the 2004 Radio Shack annual report below. You can navigate through the pages in the report by either clicking on the pages listed below, or by using the keyword search tool below to find specific information within the annual report.-
 1
1 -
2
-
3
-
4
-
5
-
6
-
7
-
8
-
9
-
10
-
11
-
 12
12 -
 13
13 -
 14
14 -
 15
15 -
 16
16 -
 17
17 -
 18
18 -
 19
19 -
 20
20 -
 21
21 -
 22
22 -
 23
23 -
 24
24 -
 25
25 -
 26
26 -
 27
27 -
 28
28 -
 29
29 -
 30
30 -
 31
31 -
 32
32 -
33
-
34
-
35
-
36
-
37
-
38
-
39
-
40
-
41
-
42
-
43
-
44
-
45
-
46
-
47
-
48
-
49
-
50
-
51
-
52
-
53
-
54
-
55
-
56
-
57
-
58
-
59
-
60
 |
 |

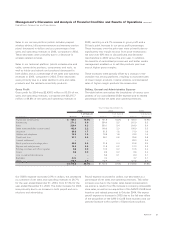
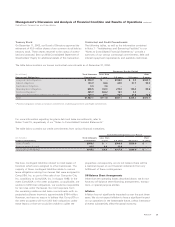
The following table provides a summary of our net sales and operating revenues by platform and as a percent of net sales
and operating revenues. Platform sales include sales from company-operated stores, kiosks, dealer outlets, and our
RadioShack.com Web site.
Net Sales and Operating Revenues
Year Ended December 31,
(In millions) 2004 2003 2002
Wireless $1,636.0 33.8% $ 1,335.8 28.7% $ 1,164.8 25.4%
Accessory 1,009.4 20.8 1,018.9 21.9 1,013.1 22.1
Modern home 700.3 14.5 812.9 17.5 973.4 21.3
Personal electronics 653.3 13.5 615.9 13.2 588.1 12.9
Power 312.0 6.4 312.4 6.7 296.4 6.5
Service 210.7 4.4 227.7 4.9 207.2 4.5
Technical 204.2 4.2 216.2 4.7 229.4 5.0
Retail support operations, service plans, and other 115.3 2.4 109.5 2.4 104.8 2.3
Net sales and operating revenues $4,841.2 100.0% $ 4,649.3 100.0% $ 4,577.2 100.0%
2004 COMPARED WITH 2003
Net Sales and Operating Revenues
Sales increased 4.1% to $4,841.2 million in 2004 from
$4,649.3 million in 2003. We had a 3% increase in compara-
ble company store sales. These increases were primarily the
result of a 22.5% increase in our wireless platform sales.
An increase in average store volume and the addition of 590
kiosk locations also contributed to our overall sales increase.
Dealer and other sales, which include sales to our dealer out-
lets, in addition to retail support operations and other sales,
were up $6.5 million for 2004, or an increase of 2.1%, when
compared to 2003. Sales to our dealers remain substantially
less than 10% of our total sales. Revenue from our retail sup-
port operations, service plans and other sales is generated
primarily from outside sales of our repair centers and domes-
tic and overseas manufacturing, in addition to our e-com-
merce revenue. The increase in these sales in 2004 was
primarily a result of our restructuring of our extended service
contract, partially offset due to the disposition of RadioShack
Installation Services (“AmeriLink”) in September 2003.
Sales in our wireless platform (which is made up of wireless
handsets and communication devices such as scanners and
two-way radios) increased in dollars and as a percentage of
net sales and operating revenues in 2004 compared to 2003.
This sales increase was due to both an increase in wireless
handset unit sales and an increase in the revenue per wireless
handsets. Emphasis on national carrier service and product
offerings with desirable product features and content, such
as color screens and cameras also drove the favorable results.
We anticipate sales in the wireless platform will increase for
2005, primarily as a result of a full year of SAM’S CLUB
kiosk sales and the planned expansion of our Sprint kiosks.
Sales in our accessory platform (which includes accessories for
home entertainment products, wireless handsets, digital imag-
ing products and computers, as well as residential phones and
power) decreased in both dollars and as a percentage of net
sales and operating revenues in 2004, compared to 2003. The
decrease in this platform resulted primarily from a decline in
home entertainment accessories, mostly offset by increases in
wireless power and digital imaging accessories.
Sales in our modern home platform (which consists of residen-
tial telephones, all home audio and video end-products, and
direct-to-home (“DTH”) satellite systems, as well as desktop,
laptop and handheld computers) decreased in both dollars and
as a percentage of net sales and operating revenues in 2004,
compared to 2003. These decreases were primarily due to a
sales decrease in DTH satellite systems, audio products and
cordless telephones, as well as a planned decrease in DTH
installation revenue resulting from our sale of AmeriLink.
Sales in our personal electronics platform (which includes
digital cameras, camcorders, toys, wellness products, mem-
ory players and satellite radios) increased in dollars and as
a percentage of net sales and operating revenues in 2004,
compared to 2003. These increases were driven primarily
by a sales increase in digital imaging products, memory
players and the introduction of our satellite radio offering.
Sales in our power platform (which includes general and spe-
cial purpose batteries and battery chargers) decreased slightly
in both dollars and as a percentage of net sales and operating
revenues in 2004, compared to 2003. These declines were pri-
marily the result of a sales decline in special purpose batteries
and battery chargers; however, the decline was substantially
offset by a sales increase in general purpose batteries.
Management’s Discussion and Analysis of Financial Condition and Results of Operations
RadioShack Corporation and Subsidiaries
20 AR2004