Radio Shack 2004 Annual Report Download - page 14
Download and view the complete annual report
Please find page 14 of the 2004 Radio Shack annual report below. You can navigate through the pages in the report by either clicking on the pages listed below, or by using the keyword search tool below to find specific information within the annual report.-
 1
1 -
2
-
3
-
 4
4 -
 5
5 -
 6
6 -
 7
7 -
 8
8 -
 9
9 -
 10
10 -
 11
11 -
 12
12 -
 13
13 -
 14
14 -
 15
15 -
 16
16 -
 17
17 -
 18
18 -
 19
19 -
 20
20 -
 21
21 -
 22
22 -
 23
23 -
 24
24 -
25
-
26
-
27
-
28
-
29
-
30
-
31
-
32
-
33
-
34
-
35
-
36
-
37
-
38
-
39
-
40
-
41
-
42
-
43
-
44
-
45
-
46
-
47
-
48
-
49
-
50
-
51
-
52
-
53
-
54
-
55
-
56
-
57
-
58
-
59
-
60
 |
 |

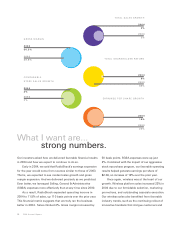
2004
18%
2003
22%
What I want are...
50 basis points. SG&A expenses were up just
2%. Combined with the impact of our aggressive
stock repurchase program, our favorable operating
results helped generate earnings per share of
$2.08, an increase of 18% over the prior year.
Once again, wireless was at the heart of our
growth. Wireless platform sales increased 22% in
2004 due to our formidable selection, marketing
promotions, and outstanding associate execution.
Our wireless sales also benefi ted from favorable
industry trends, such as the continuing rollout of
innovative handsets that intrigue customers and
Our investors asked how we delivered favorable fi nancial results
in 2004 and how we expect to continue to do so.
Early in 2004, we said that RadioShack’s earnings expansion
for the year would come from sources similar to those of 2003.
That is, we expected to see modest sales growth and gross
margin expansion. And we delivered precisely as we predicted.
Even better, we leveraged Selling, General & Administrative
(SG&A) expenses more effectively than at any time since 2000.
As a result, RadioShack expanded operating income in
2004 to 11.5% of sales, up 110 basis points over the prior year.
This fi nancial metric suggests that we truly ran the business
better in 2004. Sales climbed 4%. Gross margin increased by
COMPARABLE
STORE SALES GROWTH
2004
8%
2004
4%
2003
2%
2004
3%
2003
2%
TOTAL SHAREHOLDER RETURN
TOTAL SALES GROWTH
strong numbers.
GROSS MARGIN
2004
50.3%
2003
49.8%
2003
65%
EARNINGS PER SHARE GROWTH
12 2004 Annual Report