Quest Diagnostics 2009 Annual Report Download - page 78
Download and view the complete annual report
Please find page 78 of the 2009 Quest Diagnostics annual report below. You can navigate through the pages in the report by either clicking on the pages listed below, or by using the keyword search tool below to find specific information within the annual report.-
 1
1 -
2
-
3
-
4
-
5
-
6
-
7
-
8
-
9
-
10
-
11
-
12
-
13
-
14
-
15
-
16
-
17
-
18
-
19
-
20
-
21
-
22
-
23
-
24
-
25
-
26
-
27
-
28
-
29
-
30
-
31
-
32
-
33
-
34
-
35
-
36
-
37
-
38
-
39
-
40
-
41
-
42
-
43
-
44
-
45
-
46
-
47
-
48
-
49
-
50
-
51
-
52
-
53
-
54
-
55
-
56
-
57
-
58
-
59
-
60
-
61
-
62
-
63
-
64
-
65
-
66
-
67
-
 68
68 -
 69
69 -
 70
70 -
 71
71 -
 72
72 -
 73
73 -
 74
74 -
 75
75 -
 76
76 -
 77
77 -
 78
78 -
 79
79 -
 80
80 -
 81
81 -
 82
82 -
 83
83 -
 84
84 -
 85
85 -
 86
86 -
 87
87 -
 88
88 -
89
-
90
-
91
-
92
-
93
-
94
-
95
-
96
-
97
-
98
-
99
-
100
-
101
-
102
-
103
-
104
-
105
-
106
-
107
-
108
-
109
-
110
-
111
-
112
-
113
-
114
-
115
-
116
-
117
-
118
-
119
-
120
-
121
-
122
-
123
-
124
 |
 |

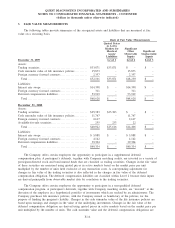
The computation of basic and diluted earnings per common share was as follows (in thousands, except per
share data):
2009 2008 2007
Amounts attributable to Quest Diagnostics’ stockholders:
Income from continuing operations ................................ $730,347 $632,184 $ 553,828
Loss from discontinued operations . ................................ (1,236) (50,694) (213,889)
Net income available to Quest Diagnostics’ common stockholders . . . $729,111 $581,490 $ 339,939
Income from continuing operations ................................ $730,347 $632,184 $ 553,828
Less: Earnings allocated to participating securities .................. 2,223 1,314 -
Earnings available to Quest Diagnostics’ common stockholders –
basic and diluted ............................................... $728,124 $630,870 $ 553,828
Weighted average common shares outstanding – basic .............. 185,948 194,283 193,241
Effect of dilutive securities:
Stock options and performance share units . . ....................... 1,850 1,676 2,021
Weighted average common shares outstanding – diluted ............ 187,798 195,959 195,262
Earnings per share attributable to Quest Diagnostics’ common
stockholders – basic:
Income from continuing operations ................................ $ 3.92 $ 3.25 $ 2.87
Loss from discontinued operations . ................................ (0.01) (0.26) (1.11)
Net income....................................................... $ 3.91 $ 2.99 $ 1.76
Earnings per share attributable to Quest Diagnostics’ common
stockholders – diluted:
Income from continuing operations ................................ $ 3.88 $ 3.22 $ 2.84
Loss from discontinued operations . ................................ (0.01) (0.26) (1.10)
Net income....................................................... $ 3.87 $ 2.96 $ 1.74
The following securities were not included in the diluted earnings per share calculation due to their
antidilutive effect (in thousands):
2009 2008 2007
Stock options and performance share units ........................... 3,559 3,631 3,706
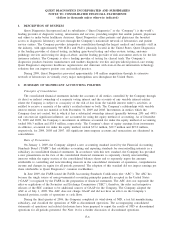
Stock-Based Compensation
The Company records stock-based compensation as a charge to earnings net of the estimated impact of
forfeited awards. As such, the Company recognizes stock-based compensation cost only for those stock-based
awards that are estimated to ultimately vest over their requisite service period, based on the vesting provisions of
the individual grants. The cumulative effect on current and prior periods of a change in the estimated forfeiture
rate is recognized as compensation cost in earnings in the period of the revision. The terms of the Company’s
performance share unit grants allow the recipients of such awards to earn a variable number of shares based on
the achievement of the performance goals specified in the awards. For performance share unit awards granted
prior to 2008, the actual amount of any stock award earned is based on the Company’s earnings per share growth
as measured in accordance with its Amended and Restated Employee Long-Term Incentive Plan (“ELTIP”) for
the performance period compared to that of a peer group of companies. Beginning with performance share unit
awards granted in 2008, the performance measure for these awards will be based on the compound annual growth
rate of the Company’s earnings per share from continuing operations over a three year period. Stock-based
compensation expense associated with performance share units is recognized based on management’s best
estimates of the achievement of the performance goals specified in such awards and the resulting number of
shares that will be earned. The cumulative effect on current and prior periods of a change in the estimated
number of performance share units expected to be earned is recognized as compensation cost in earnings in the
period of the revision. The Company recognizes stock-based compensation expense related to the Company’s
F-8
QUEST DIAGNOSTICS INCORPORATED AND SUBSIDIARIES
NOTES TO CONSOLIDATED FINANCIAL STATEMENTS - CONTINUED
(dollars in thousands unless otherwise indicated)