Quest Diagnostics 2009 Annual Report Download - page 60
Download and view the complete annual report
Please find page 60 of the 2009 Quest Diagnostics annual report below. You can navigate through the pages in the report by either clicking on the pages listed below, or by using the keyword search tool below to find specific information within the annual report.-
 1
1 -
2
-
3
-
4
-
5
-
6
-
7
-
8
-
9
-
10
-
11
-
12
-
13
-
14
-
15
-
16
-
17
-
18
-
19
-
20
-
21
-
22
-
23
-
24
-
25
-
26
-
27
-
28
-
29
-
30
-
31
-
32
-
33
-
34
-
35
-
36
-
37
-
38
-
39
-
40
-
41
-
42
-
43
-
44
-
45
-
46
-
47
-
48
-
49
-
 50
50 -
 51
51 -
 52
52 -
 53
53 -
 54
54 -
 55
55 -
 56
56 -
 57
57 -
 58
58 -
 59
59 -
 60
60 -
 61
61 -
 62
62 -
 63
63 -
 64
64 -
 65
65 -
 66
66 -
 67
67 -
 68
68 -
 69
69 -
 70
70 -
71
-
72
-
73
-
74
-
75
-
76
-
77
-
78
-
79
-
80
-
81
-
82
-
83
-
84
-
85
-
86
-
87
-
88
-
89
-
90
-
91
-
92
-
93
-
94
-
95
-
96
-
97
-
98
-
99
-
100
-
101
-
102
-
103
-
104
-
105
-
106
-
107
-
108
-
109
-
110
-
111
-
112
-
113
-
114
-
115
-
116
-
117
-
118
-
119
-
120
-
121
-
122
-
123
-
124
 |
 |
offsetting adjustment is also recorded to the deferred compensation obligation to reflect investment gains and
losses earned by the employee. Such adjustments to the deferred compensation obligation are recorded in earnings
principally within “selling, general and administrative expenses” and offset the amount of investment gains and
losses recorded in “other expense, net.” Results for 2009 included an increase in operating costs of $6.0 million,
representing an increase in the deferred compensation obligation to reflect investment gains earned by employees
participating in our deferred compensation plan. Results for 2008 included a reduction in operating costs of $9.9
million, representing a decrease in the deferred compensation obligation to reflect investment losses incurred by
employees participating in our deferred compensation plan.
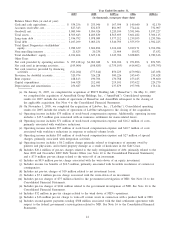
Cost of services, which includes the costs of obtaining, transporting and testing specimens, was 58% of net
revenues for the year ended December 31, 2009, compared to 58.7% of net revenues in 2008. The improvement
over the prior year reflects actions taken to reduce our cost structure and higher revenue per requisition.
Selling, general and administrative expenses, which include the costs of the sales force, billing operations,
bad debt expense, and general management and administrative support, were 23.4% of net revenues for the year
ended December 31, 2009, compared to 24.0% in the prior year period. The improvement was primarily due to
actions taken to reduce our cost structure and higher revenue per requisition. In addition, year-over-year
comparisons of selling, general and administrative expenses as a percentage of net revenues were adversely
impacted by approximately 20 basis points associated with investment gains and losses earned by employees on
assets held in trust under our deferred compensation plan discussed earlier.
For the year ended December 31, 2009, bad debt expense was 4.3% of net revenues compared to 4.5% in
the prior year period. Continued progress in our billing and collection processes has resulted in stable bad debt,
and improvements in days sales outstanding and the cost of our billing operation. With our disciplined approach,
we expect to see continued strong performance in our billing and collection metrics, despite a slow economy.
Other operating (income) expense, net represents miscellaneous income and expense items related to
operating activities, including gains and losses associated with the disposal of operating assets and provisions for
restructurings and other special charges. For the year ended December 31, 2009, other operating (income)
expense, net includes a $15.5 million second quarter gain associated with an insurance settlement for storm-
related losses.
Operating Income
Operating income for the year ended December 31, 2009 was $1.4 billion, or 18.2% of net revenues,
compared to $1.2 billion, or 16.9% of net revenues, in the prior year period. The improvement in operating
income, as a percentage of net revenues, was primarily due to higher revenue per requisition and progress we are
making with our cost reduction program, as well as discrete cost containment actions we took during 2009.
Operating income for the year ended December 31, 2009 also includes a $15.5 million gain associated with an
insurance settlement for storm-related losses, which contributed approximately 20 basis points to the
improvement. The operating income percentage for the year ended December 31, 2009 also reflects the impact of
the various items which served to reduce cost of services and selling, general and administrative expenses as a
percentage of net revenues. Results for the year ended December 31, 2008 include a charge of $16.2 million,
primarily associated with workforce reductions, which reduced operating income, as a percentage of net revenues,
by approximately 20 basis points. In addition, year-over-year comparisons were adversely impacted by
approximately $16 million, or approximately 20 basis points, associated with investment gains and losses earned
by employees on assets held in trust under our deferred compensation plan.
Other Income (Expense)
Interest expense, net for the year ended December 31, 2009 decreased $36 million compared to the prior
year period. The decrease was primarily due to lower interest rates on our variable-interest rate debt compared to
the prior year period.
Other expense, net represents miscellaneous income and expense items related to non-operating activities
such as gains and losses associated with investments and other non-operating assets. For the year ended
December 31, 2009, other expense, net includes $20.4 million of pre-tax charges associated with the early
extinguishment of debt and a $7.0 million charge associated with the write-down of an investment, partially
offset by gains of $6.0 million associated with investments held in trust pursuant to our supplemental deferred
compensation plan. For the year ended December 31, 2008, other expense, net includes a third quarter charge of
$8.9 million associated with the write-down of an equity investment and losses of $9.9 million associated with
investments held in a trust pursuant to our supplemental deferred compensation plan.
50