Quest Diagnostics 2009 Annual Report Download - page 2
Download and view the complete annual report
Please find page 2 of the 2009 Quest Diagnostics annual report below. You can navigate through the pages in the report by either clicking on the pages listed below, or by using the keyword search tool below to find specific information within the annual report.-
 1
1 -
 2
2 -
 3
3 -
 4
4 -
 5
5 -
 6
6 -
 7
7 -
 8
8 -
 9
9 -
 10
10 -
 11
11 -
 12
12 -
 13
13 -
14
-
15
-
16
-
17
-
18
-
19
-
20
-
21
-
22
-
23
-
24
-
25
-
26
-
27
-
28
-
29
-
30
-
31
-
32
-
33
-
34
-
35
-
36
-
37
-
38
-
39
-
40
-
41
-
42
-
43
-
44
-
45
-
46
-
47
-
48
-
49
-
50
-
51
-
52
-
53
-
54
-
55
-
56
-
57
-
58
-
59
-
60
-
61
-
62
-
63
-
64
-
65
-
66
-
67
-
68
-
69
-
70
-
71
-
72
-
73
-
74
-
75
-
76
-
77
-
78
-
79
-
80
-
81
-
82
-
83
-
84
-
85
-
86
-
87
-
88
-
89
-
90
-
91
-
92
-
93
-
94
-
95
-
96
-
97
-
98
-
99
-
100
-
101
-
102
-
103
-
104
-
105
-
106
-
107
-
108
-
109
-
110
-
111
-
112
-
113
-
114
-
115
-
116
-
117
-
118
-
119
-
120
-
121
-
122
-
123
-
124
 |
 |

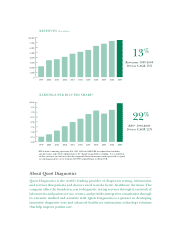
About Quest Diagnostics
Quest Diagnostics is the world’s leading provider of diagnostic testing, information
and services that patients and doctors need to make better healthcare decisions. The
company offers the broadest access to diagnostic testing services through its network of
laboratories and patient service centers, and provides interpretive consultation through
its extensive medical and scientific staff. Quest Diagnostics is a pioneer in developing
innovative diagnostic tests and advanced healthcare information technology solutions
that help improve patient care.
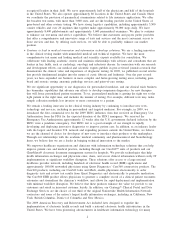
EARNINGS PER DILUTED SHARE*
EPS* 1999-2009
10-year CAGR 22%
0.00
0.50
1.00
1.50
2.00
2.50
3.00
3.50
$4.00
*EPS is from continuing operations. For 1999, 2000 and 2001 EPS was adjusted and excludes
special charges and reflects adjustments for the change in goodwill accounting. A reconciliation
of these measures and the most directly comparable financial measures under generally accepted
accounting principles can be found in the 2009 Annual Report on Form 10-K.
2009
2008200720062005200420032002200120001999
REVENUES ($ in millions)
0
1,000
2,000
3,000
4,000
5,000
6,000
7,000
$8,000
20092008200720062005200420032002200120001999
Revenues 1999-2009
10-year CAGR 13%
13%