Quest Diagnostics 2009 Annual Report Download - page 51
Download and view the complete annual report
Please find page 51 of the 2009 Quest Diagnostics annual report below. You can navigate through the pages in the report by either clicking on the pages listed below, or by using the keyword search tool below to find specific information within the annual report.-
 1
1 -
2
-
3
-
4
-
5
-
6
-
7
-
8
-
9
-
10
-
11
-
12
-
13
-
14
-
15
-
16
-
17
-
18
-
19
-
20
-
21
-
22
-
23
-
24
-
25
-
26
-
27
-
28
-
29
-
30
-
31
-
32
-
33
-
34
-
35
-
36
-
37
-
38
-
39
-
40
-
 41
41 -
 42
42 -
 43
43 -
 44
44 -
 45
45 -
 46
46 -
 47
47 -
 48
48 -
 49
49 -
 50
50 -
 51
51 -
 52
52 -
 53
53 -
 54
54 -
 55
55 -
 56
56 -
 57
57 -
 58
58 -
 59
59 -
 60
60 -
 61
61 -
62
-
63
-
64
-
65
-
66
-
67
-
68
-
69
-
70
-
71
-
72
-
73
-
74
-
75
-
76
-
77
-
78
-
79
-
80
-
81
-
82
-
83
-
84
-
85
-
86
-
87
-
88
-
89
-
90
-
91
-
92
-
93
-
94
-
95
-
96
-
97
-
98
-
99
-
100
-
101
-
102
-
103
-
104
-
105
-
106
-
107
-
108
-
109
-
110
-
111
-
112
-
113
-
114
-
115
-
116
-
117
-
118
-
119
-
120
-
121
-
122
-
123
-
124
 |
 |

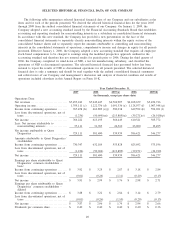
2009 2008 2007(a) 2006 2005(b)
Year Ended December 31,
(in thousands, except per share data)
Balance Sheet Data (at end of year):
Cash and cash equivalents . . . ............ $ 534,256 $ 253,946 $ 167,594 $ 149,640 $ 92,130
Accounts receivable, net................. 827,343 832,873 881,967 774,414 732,907
Goodwill, net ........................... 5,083,944 5,054,926 5,220,104 3,391,046 3,197,227
Total assets ............................. 8,563,643 8,403,830 8,565,693 5,661,482 5,306,115
Long-term debt ......................... 2,936,792 3,078,089 3,377,212 1,239,105 1,255,386
Total debt .............................. 3,107,299 3,083,231 3,540,793 1,555,979 1,592,225
Total Quest Diagnostics stockholders’
equity . . .............................. 3,989,639 3,604,896 3,324,242 3,019,171 2,762,984
Noncontrolling interests ................. 21,825 20,238 21,464 19,632 17,632
Total stockholders’ equity . . . ............ 4,011,464 3,625,134 3,345,706 3,038,803 2,780,616
Other Data:
Net cash provided by operating activities. $ 997,418 (q) $1,063,049 $ 926,924 $ 951,896 $ 851,583
Net cash used in investing activities . . . . . (195,904) (198,883) (1,759,193) (414,402) (1,079,793)
Net cash (used in) provided by financing
activities ............................. (521,204) (777,814) 850,223 (479,984) 247,038
Provision for doubtful accounts .......... 320,974 326,228 300,226 243,443 233,628
Rent expense ........................... 188,813 190,706 170,788 153,185 139,660
Capital expenditures..................... 166,928 212,681 219,101 193,422 224,270
Depreciation and amortization ........... 256,687 264,593 237,879 197,398 176,124
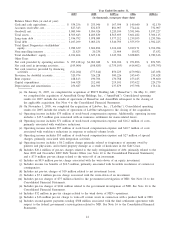
(a) On January 31, 2007, we completed the acquisition of POCT Holding AB, (“HemoCue”). On May 31, 2007,
we completed the acquisition of AmeriPath Group Holdings, Inc., (“AmeriPath”). Consolidated operating
results for 2007 include the results of operations of HemoCue and AmeriPath subsequent to the closing of
the applicable acquisition. See Note 4 to the Consolidated Financial Statements.
(b) On November 1, 2005, we completed the acquisition of LabOne, Inc., (“LabOne”).Consolidated operating
results for 2005 include the results of operations of LabOne subsequent to the closing of the acquisition.
(c) Operating income includes $75 million of stock-based compensation expense. Additionally, operating income
includes a $15.5 million gain associated with an insurance settlement for storm-related losses.
(d) Operating income includes $71 million of stock-based compensation expense and $16.2 million of costs,
primarily associated with workforce reductions.
(e) Operating income includes $57 million of stock-based compensation expense and $10.7 million of costs
associated with workforce reductions in response to reduced volume levels.
(f) Operating income includes $55 million of stock-based compensation expense and $27 million of special
charges, primarily associated with integration activities.
(g) Operating income includes a $6.2 million charge primarily related to forgiveness of amounts owed by
patients and physicians, and related property damage as a result of hurricanes in the Gulf Coast.
(h) Includes $20.4 million of pre-tax charges related to the early extinguishment of debt, primarily related to the
June 2009 and November 2009 Debt Tender Offers (see Note 10 to the Consolidated Financial Statements)
and a $7.0 million pre-tax charge related to the write-off of an investment.
(i) Includes an $8.9 million pre-tax charge associated with the write-down of an equity investment.
(j) Includes income tax benefits of $16.5 million, primarily associated with favorable resolutions of certain tax
contingencies.
(k) Includes net pre-tax charges of $10 million related to net investment losses.
(l) Includes a $7.1 million pre-tax charge associated with the write-down of an investment.
(m) Includes pre-tax charges of $75 million related to the government investigation of NID. See Note 16 to the
Consolidated Financial Statements.
(n) Includes pre-tax charges of $241 million related to the government investigation of NID. See Note 16 to the
Consolidated Financial Statements.
(o) Includes $32 million in pre-tax charges related to the wind down of NID’s operations.
(p) Includes a $16 million pre-tax charge to write-off certain assets in connection with a product hold at NID.
(q) Includes second quarter payments totaling $308 million associated with the final settlement agreement with
respect to the federal government’s investigation related to NID. See Note 16 to the Consolidated Financial
Statements.
41