Quest Diagnostics 2009 Annual Report Download - page 121
Download and view the complete annual report
Please find page 121 of the 2009 Quest Diagnostics annual report below. You can navigate through the pages in the report by either clicking on the pages listed below, or by using the keyword search tool below to find specific information within the annual report.-
 1
1 -
2
-
3
-
4
-
5
-
6
-
7
-
8
-
9
-
10
-
11
-
12
-
13
-
14
-
15
-
16
-
17
-
18
-
19
-
20
-
21
-
22
-
23
-
24
-
25
-
26
-
27
-
28
-
29
-
30
-
31
-
32
-
33
-
34
-
35
-
36
-
37
-
38
-
39
-
40
-
41
-
42
-
43
-
44
-
45
-
46
-
47
-
48
-
49
-
50
-
51
-
52
-
53
-
54
-
55
-
56
-
57
-
58
-
59
-
60
-
61
-
62
-
63
-
64
-
65
-
66
-
67
-
68
-
69
-
70
-
71
-
72
-
73
-
74
-
75
-
76
-
77
-
78
-
79
-
80
-
81
-
82
-
83
-
84
-
85
-
86
-
87
-
88
-
89
-
90
-
91
-
92
-
93
-
94
-
95
-
96
-
97
-
98
-
99
-
100
-
101
-
102
-
103
-
104
-
105
-
106
-
107
-
108
-
109
-
110
-
 111
111 -
 112
112 -
 113
113 -
 114
114 -
 115
115 -
 116
116 -
 117
117 -
 118
118 -
 119
119 -
 120
120 -
 121
121 -
 122
122 -
 123
123 -
 124
124
 |
 |

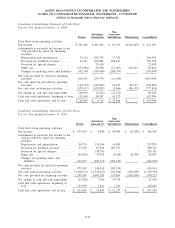
QUEST DIAGNOSTICS INCORPORATED AND SUBSIDIARIES
RECONCILIATION OF NON-GAAP MEASURES
The following is a reconciliation of non-GAAP measures presented in the financial highlights to their most
comparable measure under generally accepted accounting principles (in thousands, except per share data).
2009 2008 2007 2006 2005
Year Ended December 31,
Amounts attributable to Quest Diagnostics’
stockholders:
Income from continuing operations.................. $730,347 $632,184 $553,828 $625,692 $573,196
Add:
Amortization of goodwill, net of taxes ................ - ----
Adjusted income from continuing operations ........ $730,347 $632,184 $553,828 $625,692 $573,196
Earnings per share attributable to Quest
Diagnostics’ common stockholders - diluted:
Reported diluted earnings per common share from
continuing operations .............................. $ 3.88 $ 3.22 $ 2.84 $ 3.14 $ 2.79
Adjusted diluted earnings per common share from
continuing operations .............................. $ 3.88 $ 3.22 $ 2.84 $ 3.14 $ 2.79
Weighted average number of common shares
outstanding - diluted ............................... 187,798 195,959 195,262 199,542 205,530
2004 2003 2002 2001 2000 1999
Year Ended December 31,
Amounts attributable to Quest
Diagnostics’ stockholders:
Income from continuing operations ...... $492,415 $429,173 $317,445 $161,624 $105,471 $ 4,797
Add:
Amortization of goodwill, net of taxes ..... - - - 35,246 35,305 21,295
Provision for restructuring and other
special charges, net of taxes ............ - - - - - 44,118
Loss on debt extinguishment, net of taxes. . - - - 25,207 2,896 2,139
Adjusted income from continuing
operations . . . ........................... $492,415 $429,173 $317,445 $222,077 $143,672 $ 72,349
Earnings per share attributable to Quest
Diagnostics’ common stockholders –
diluted:
Reported diluted earnings per common
share from continuing operations ........ $ 2.32 $ 1.99 $ 1.57 $ 0.83 $ 0.56 $ 0.03
Adjusted diluted earnings per common
share from continuing operations ........ $ 2.32 $ 1.99 $ 1.57 $ 1.13 $ 0.76 $ 0.51
Weighted average number of common
shares outstanding - diluted ............. 214,145 217,578 205,294 195,779 188,601 143,309
Reconciliation of Non-GAAP Measures