Quest Diagnostics 2009 Annual Report Download - page 111
Download and view the complete annual report
Please find page 111 of the 2009 Quest Diagnostics annual report below. You can navigate through the pages in the report by either clicking on the pages listed below, or by using the keyword search tool below to find specific information within the annual report.-
 1
1 -
2
-
3
-
4
-
5
-
6
-
7
-
8
-
9
-
10
-
11
-
12
-
13
-
14
-
15
-
16
-
17
-
18
-
19
-
20
-
21
-
22
-
23
-
24
-
25
-
26
-
27
-
28
-
29
-
30
-
31
-
32
-
33
-
34
-
35
-
36
-
37
-
38
-
39
-
40
-
41
-
42
-
43
-
44
-
45
-
46
-
47
-
48
-
49
-
50
-
51
-
52
-
53
-
54
-
55
-
56
-
57
-
58
-
59
-
60
-
61
-
62
-
63
-
64
-
65
-
66
-
67
-
68
-
69
-
70
-
71
-
72
-
73
-
74
-
75
-
76
-
77
-
78
-
79
-
80
-
81
-
82
-
83
-
84
-
85
-
86
-
87
-
88
-
89
-
90
-
91
-
92
-
93
-
94
-
95
-
96
-
97
-
98
-
99
-
100
-
 101
101 -
 102
102 -
 103
103 -
 104
104 -
 105
105 -
 106
106 -
 107
107 -
 108
108 -
 109
109 -
 110
110 -
 111
111 -
 112
112 -
 113
113 -
 114
114 -
 115
115 -
 116
116 -
 117
117 -
 118
118 -
 119
119 -
 120
120 -
 121
121 -
122
-
123
-
124
 |
 |

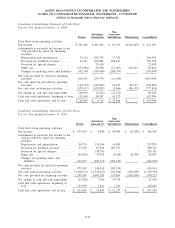
Condensed Consolidating Statement of Operations
For the Year Ended December 31, 2007
Parent
Subsidiary
Guarantors
Non-
Guarantor
Subsidiaries Eliminations Consolidated
Net revenues ................................ $ 821,908 $5,488,797 $715,478 $(321,276) $6,704,907
Operating costs and expenses:
Cost of services........................... 458,544 3,265,817 245,487 - 3,969,848
Selling, general and administrative ......... 162,857 1,153,522 319,934 (23,455) 1,612,858
Amortization of intangible assets........... 222 21,013 6,669 - 27,904
Royalty (income) expense . . . .............. (393,975) 393,975 - - -
Other operating expense (income), net ..... 51 (2,578) 5,488 - 2,961
Total operating costs and expenses . ..... 227,699 4,831,749 577,578 (23,455) 5,613,571
Operating income ........................... 594,209 657,048 137,900 (297,821) 1,091,336
Non-operating (expense) income, net ......... (178,849) (282,187) 10,791 297,821 (152,424)
Income from continuing operations before
taxes ..................................... 415,360 374,861 148,691 - 938,912
Income tax expense . . ....................... 157,270 150,994 50,310 - 358,574
Income from continuing operations ........... 258,090 223,867 98,381 - 580,338
(Loss) income from discontinued operations,
net of taxes............................... - (213,917) 28 - (213,889)
Equity earnings from subsidiaries ............ 81,849 - - (81,849) -
Net income ................................. 339,939 9,950 98,409 (81,849) 366,449
Less: Net income attributable to
noncontrolling interests .................... - - 26,510 - 26,510
Net income attributable to Quest Diagnostics . $ 339,939 $ 9,950 $ 71,899 $ (81,849) $ 339,939
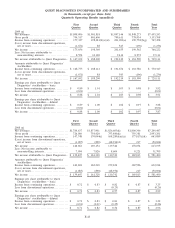
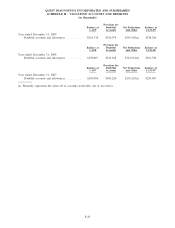
Condensed Consolidating Statement of Cash Flows
For the Year Ended December 31, 2009
Parent
Subsidiary
Guarantors
Non-
Guarantor
Subsidiaries Eliminations Consolidated
Cash flows from operating activities:
Net income ................................. $ 729,111 $ 394,096 $ 102,898 $(459,883) $ 766,222
Adjustments to reconcile net income to net
cash provided by operating activities:
Depreciation and amortization ............. 54,627 185,743 16,317 - 256,687
Provision for doubtful accounts ............ 5,986 68,089 246,899 - 320,974
Provision for special charges .............. - - - - -
Other, net ................................ (381,358) 96,546 7,267 459,883 182,338
Changes in operating assets and liabilities . . 228,809 (559,602) (198,010) - (528,803)
Net cash provided by operating activities ..... 637,175 184,872 175,371 - 997,418
Net cash (used in) provided by investing
activities. ................................. (15,549) (160,259) 14,372 (34,468) (195,904)
Net cash used in financing activities . . . ...... (375,233) (13,871) (166,568) 34,468 (521,204)
Net change in cash and cash equivalents ..... 246,393 10,742 23,175 - 280,310
Cash and cash equivalents, beginning of year . 218,565 6,715 28,666 - 253,946
Cash and cash equivalents, end of year. ...... $ 464,958 $ 17,457 $ 51,841 $ - $ 534,256
F-41
QUEST DIAGNOSTICS INCORPORATED AND SUBSIDIARIES
NOTES TO CONSOLIDATED FINANCIAL STATEMENTS - CONTINUED
(dollars in thousands unless otherwise indicated)