Quest Diagnostics 2009 Annual Report Download - page 66
Download and view the complete annual report
Please find page 66 of the 2009 Quest Diagnostics annual report below. You can navigate through the pages in the report by either clicking on the pages listed below, or by using the keyword search tool below to find specific information within the annual report.
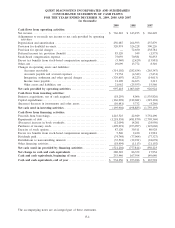
Net cash used in financing activities in 2008 was $778 million, consisting primarily of net reductions of debt
of $459 million. Debt repayments of $482 million, consisting primarily of the repayment of $120 million on our
secured receivables credit facility, $60 million on our term loan due December 31, 2008 and $293 million on our
term loan due May 2012, were partially offset by borrowings of $20 million under our secured receivables credit
facility.
Net cash used in financing activities in 2008 also included purchases of treasury stock totaling $254 million
and dividend payments of $78 million. The $254 million of treasury stock purchases represents 5.5 million shares
of our common stock purchased at an average price of $46.09 per share. These amounts were partially offset by
$33 million in proceeds from the exercise of stock options, including related tax benefits.
Dividend Program
During each of the quarters of 2009 and 2008, our Board of Directors declared a quarterly cash dividend of
$0.10 per common share. We expect to fund future dividend payments with cash flows from operations, and do
not expect the dividend to have a material impact on our ability to finance future growth.
Share Repurchase Plan
For the year ended December 31, 2009, we repurchased 10 million shares of our common stock at an
average price of $49.83 per share for $500 million, including 4.5 million shares repurchased from SB Holdings
Capital Inc., a wholly-owned subsidiary of GlaxoSmithKline plc., at an average price of $44.33 per share for
$200 million. For the year ended December 31, 2008, we repurchased 5.5 million shares of our common stock at
an average price of $46.09 per share for $254 million. For the years ended December 31, 2009 and 2008, the
Company reissued 3.0 million shares and 1.5 million shares, respectively, for employee benefit plans. Since the
inception of our share repurchase program in May 2003, we have repurchased approximately 59.7 million shares
of our common stock at an average price of $46.17 for $2.8 billion under our share repurchase program. At
December 31, 2009, existing share repurchase authorizations were fully utilized.
In January 2010, our Board of Directors authorized $750 million of additional share repurchases. The share
repurchase authorization has no set expiration or termination date.
Also, in January 2010, we executed an accelerated share repurchase transaction with a bank to acquire
approximately 4.5 million shares of our outstanding common stock, at an initial purchase price of $56.05 per
share, for $250 million. The purchase price for these shares is subject to an adjustment based on the volume
weighted average price of our common stock during a period following the execution of the agreement.
Contractual Obligations and Commitments
The following table summarizes certain of our contractual obligations as of December 31, 2009.
Contractual Obligations Total
Less than
1 year 1–3 years 3–5 years
After
5 years
(in thousands)
Payments due by period
Long-term debt ................................. $3,116,802 $165,482 $ 901,268 $ - $2,050,052
Capital lease obligations......................... 25,294 5,025 6,351 4,272 9,646
Interest payments on outstanding debt............ 1,756,658 133,513 229,367 320,962 1,072,816
Operating leases ................................ 671,007 174,787 228,463 113,957 153,800
Purchase obligations . . . ......................... 130,032 51,455 62,136 13,081 3,360
Total contractual obligations ................ $5,699,793 $530,262 $1,427,585 $452,272 $3,289,674
Interest payments on our long-term debt have been calculated after giving effect to our interest rate swap
agreements, using the interest rates as of December 31, 2009 applied to the December 31, 2009 balances, which
are assumed to remain outstanding through their maturity dates.
A full description of the terms of our indebtedness and related debt service requirements and our future
payments under certain of our contractual obligations is contained in Note 10 to the Consolidated Financial
Statements. A full discussion and analysis regarding our minimum rental commitments under noncancelable
operating leases and noncancelable commitments to purchase product or services at December 31, 2009 is
contained in Note 15 to the Consolidated Financial Statements.
56


