Quest Diagnostics 2009 Annual Report Download - page 75
Download and view the complete annual report
Please find page 75 of the 2009 Quest Diagnostics annual report below. You can navigate through the pages in the report by either clicking on the pages listed below, or by using the keyword search tool below to find specific information within the annual report.-
 1
1 -
2
-
3
-
4
-
5
-
6
-
7
-
8
-
9
-
10
-
11
-
12
-
13
-
14
-
15
-
16
-
17
-
18
-
19
-
20
-
21
-
22
-
23
-
24
-
25
-
26
-
27
-
28
-
29
-
30
-
31
-
32
-
33
-
34
-
35
-
36
-
37
-
38
-
39
-
40
-
41
-
42
-
43
-
44
-
45
-
46
-
47
-
48
-
49
-
50
-
51
-
52
-
53
-
54
-
55
-
56
-
57
-
58
-
59
-
60
-
61
-
62
-
63
-
64
-
 65
65 -
 66
66 -
 67
67 -
 68
68 -
 69
69 -
 70
70 -
 71
71 -
 72
72 -
 73
73 -
 74
74 -
 75
75 -
 76
76 -
 77
77 -
 78
78 -
 79
79 -
 80
80 -
 81
81 -
 82
82 -
 83
83 -
 84
84 -
 85
85 -
86
-
87
-
88
-
89
-
90
-
91
-
92
-
93
-
94
-
95
-
96
-
97
-
98
-
99
-
100
-
101
-
102
-
103
-
104
-
105
-
106
-
107
-
108
-
109
-
110
-
111
-
112
-
113
-
114
-
115
-
116
-
117
-
118
-
119
-
120
-
121
-
122
-
123
-
124
 |
 |

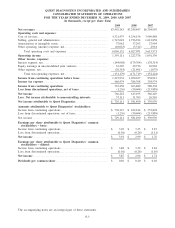
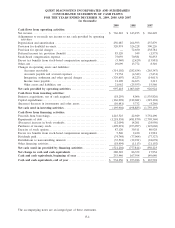
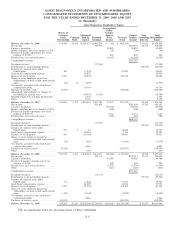
QUEST DIAGNOSTICS INCORPORATED AND SUBSIDIARIES
CONSOLIDATED STATEMENTS OF STOCKHOLDERS’ EQUITY
FOR THE YEARS ENDED DECEMBER 31, 2009, 2008 AND 2007
(in thousands)
Shares of
Common
Stock
Outstanding
Common
Stock
Additional
Paid-In
Capital
Retained
Earnings
Accumulated
Other
Compre-
hensive
(Loss)
Income
Treasury
Stock
Compre-
hensive
Income
Non-
controlling
Interests
Total
Stockholders’
Equity
Quest Diagnostics Stockholders’ Equity
Balance, December 31, 2006 . . . . . . . . . . . . . . . . 193,949 $2,138 $2,185,073 $1,800,255 $ (65) $ (968,230) $ 19,632 $3,038,803
Net income . . . . . . . . . . . . ..................... 339,939 $339,939 26,510 366,449
Currency translation . . . . ..................... 30,820 30,820 30,820
Market valuation, net of tax benefit of $24 . . . (36) (36) (36)
Reversal of market adjustment, net of tax
expense of $(510) . . . . ..................... 802 802 802
Deferred loss, less reclassifications . . . . . . . . . . . (6,242) (6,242) (6,242)
Comprehensive income . ..................... $365,283
Dividends declared . . . . . ..................... (77,304) (77,304)
Distributions to noncontrolling interests . . . . . . . (24,678) (24,678)
Issuance of common stock under
benefit plans . . . . . . . . . ..................... 462 (1,974) 21,989 20,015
Stock-based compensation expense . . . . . . . . . . . 56,853 56,853
Exercise of stock options . . . . . . . . . . . . . . . . . . . . 2,447 (39,230) 120,158 80,928
Shares to cover employee payroll tax
withholdings on stock issued under benefit
plans . . . . . . . . . . . . . . . . ..................... (24) (1) (1,229) (1,230)
Tax benefits associated with stock-based
compensation plans . . ..................... 16,703 16,703
Purchase of treasury stock . . . . . . . . . . . . . . . . . . . (2,794) (145,660) (145,660)
Adjustments upon adoption of change in
accounting for income taxes . . . . . . . . . . . . . . . (10,441) (5,146) (15,587)
Reimbursement from Corning Incorporated . . . 2,345 2,345
Other....................................... 2,725 2,725
Balance, December 31, 2007 . . . . . . . . . . . . . . . . 194,040 2,137 2,210,825 2,057,744 25,279 (971,743) 21,464 3,345,706
Net income . . . . . . . . . . . . ..................... 581,490 $581,490 31,705 613,195
Currency translation . . . . ..................... (94,326) (94,326) (94,326)
Market valuation, net of tax benefit of $261 . . (398) (398) (398)
Reversal of market adjustment, net of tax
expense of $(1,257) . . ..................... 2,161 2,161 2,161
Deferred loss, less reclassifications . . . . . . . . . . . (784) (784) (784)
Comprehensive income . ..................... $488,143
Dividends declared . . . . . ..................... (77,555) (77,555)
Distributions to noncontrolling interests . . . . . . . (32,931) (32,931)
Issuance of common stock under
benefit plans . . . . . . . . . ..................... 913 4 81 18,248 18,333
Stock-based compensation expense . . . . . . . . . . . 63,055 7,526 70,581
Exercise of stock options . . . . . . . . . . . . . . . . . . . . 987 (18,148) 48,659 30,511
Shares to cover employee payroll tax
withholdings on stock issued under benefit
plans . . . . . . . . . . . . . . . . ..................... (56) (962) (1,614) (2,576)
Tax benefits associated with stock-based
compensation plans . . ..................... 6,881 6,881
Purchases of treasury stock . . . . . . . . . . . . . . . . . . (5,510) (253,997) (253,997)
Other....................................... 333 333
Balance, December 31, 2008 . . . . . . . . . . . . . . . . 190,374 2,141 2,262,065 2,561,679 (68,068) (1,152,921) 20,238 3,625,134
Net income . . . . . . . . . . . . ..................... 729,111 $729,111 37,111 766,222
Currency translation . . . . ..................... 49,586 49,586 49,586
Reversal of market valuation, net of tax
expense of $(190) . . . . ..................... 290 290 290
Deferred loss, less reclassifications . . . . . . . . . . . (2,553) (2,553) (2,553)
Other....................................... (216) (216) (216)
Comprehensive income . ..................... $776,218
Dividends declared . . . . . ..................... (74,151) (74,151)
Distributions to noncontrolling interests . . . . . . . (35,524) (35,524)
Issuance of common stock under
benefit plans . . . . . . . . . ..................... 711 1,868 17,913 19,781
Stock-based compensation expense . . . . . . . . . . . 61,005 14,054 75,059
Exercise of stock options . . . . . . . . . . . . . . . . . . . . 2,376 (27,272) 114,392 87,120
Shares to cover employee payroll tax
withholdings on stock issued under benefit
plans . . . . . . . . . . . . . . . . ..................... (135) (2,144) (3,995) (6,139)
Tax benefits associated with stock-based
compensation plans . . ..................... 6,846 6,846
Purchases of treasury stock . . . . . . . . . . . . . . . . . . (10,033) (499,991) (499,991)
Balance, December 31, 2009 . . . . . . . . . . . . . . . . 183,293 $2,141 $2,302,368 $3,216,639 $(20,961) $(1,510,548) $ 21,825 $4,011,464
The accompanying notes are an integral part of these statements.
F-5