Quest Diagnostics 2009 Annual Report Download - page 73
Download and view the complete annual report
Please find page 73 of the 2009 Quest Diagnostics annual report below. You can navigate through the pages in the report by either clicking on the pages listed below, or by using the keyword search tool below to find specific information within the annual report.-
 1
1 -
2
-
3
-
4
-
5
-
6
-
7
-
8
-
9
-
10
-
11
-
12
-
13
-
14
-
15
-
16
-
17
-
18
-
19
-
20
-
21
-
22
-
23
-
24
-
25
-
26
-
27
-
28
-
29
-
30
-
31
-
32
-
33
-
34
-
35
-
36
-
37
-
38
-
39
-
40
-
41
-
42
-
43
-
44
-
45
-
46
-
47
-
48
-
49
-
50
-
51
-
52
-
53
-
54
-
55
-
56
-
57
-
58
-
59
-
60
-
61
-
62
-
 63
63 -
 64
64 -
 65
65 -
 66
66 -
 67
67 -
 68
68 -
 69
69 -
 70
70 -
 71
71 -
 72
72 -
 73
73 -
 74
74 -
 75
75 -
 76
76 -
 77
77 -
 78
78 -
 79
79 -
 80
80 -
 81
81 -
 82
82 -
 83
83 -
84
-
85
-
86
-
87
-
88
-
89
-
90
-
91
-
92
-
93
-
94
-
95
-
96
-
97
-
98
-
99
-
100
-
101
-
102
-
103
-
104
-
105
-
106
-
107
-
108
-
109
-
110
-
111
-
112
-
113
-
114
-
115
-
116
-
117
-
118
-
119
-
120
-
121
-
122
-
123
-
124
 |
 |

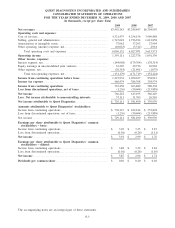
QUEST DIAGNOSTICS INCORPORATED AND SUBSIDIARIES
CONSOLIDATED STATEMENTS OF OPERATIONS
FOR THE YEARS ENDED DECEMBER 31, 2009, 2008 AND 2007
(in thousands, except per share data)
2009 2008 2007
Net revenues ......................................................... $7,455,243 $7,249,447 $6,704,907
Operating costs and expenses:
Cost of services ....................................................... 4,321,475 4,256,156 3,969,848
Selling, general and administrative ..................................... 1,747,618 1,736,934 1,612,858
Amortization of intangible assets . ...................................... 37,062 37,293 27,904
Other operating (income) expense, net .................................. (10,023) (3,312) 2,961
Total operating costs and expenses................................. 6,096,132 6,027,071 5,613,571
Operating income .................................................... 1,359,111 1,222,376 1,091,336
Other income (expense):
Interest expense, net ................................................... (144,068) (179,764) (178,314)
Equity earnings in unconsolidated joint ventures......................... 33,207 29,736 26,969
Other expense, net..................................................... (20,318) (21,691) (1,079)
Total non-operating expenses, net .................................. (131,179) (171,719) (152,424)
Income from continuing operations before taxes ...................... 1,227,932 1,050,657 938,912
Income tax expense................................................... 460,474 386,768 358,574
Income from continuing operations ................................... 767,458 663,889 580,338
Loss from discontinued operations, net of taxes....................... (1,236) (50,694) (213,889)
Net income ........................................................... 766,222 613,195 366,449
Less: Net income attributable to noncontrolling interests ............. 37,111 31,705 26,510
Net income attributable to Quest Diagnostics ......................... $ 729,111 $ 581,490 $ 339,939
Amounts attributable to Quest Diagnostics’ stockholders:
Income from continuing operations ..................................... $ 730,347 $ 632,184 $ 553,828
Loss from discontinued operations, net of taxes ......................... (1,236) (50,694) (213,889)
Net income . . . ........................................................ $ 729,111 $ 581,490 $ 339,939
Earnings per share attributable to Quest Diagnostics’ common
stockholders – basic:
Income from continuing operations ..................................... $ 3.92 $ 3.25 $ 2.87
Loss from discontinued operations...................................... (0.01) (0.26) (1.11)
Net income ........................................................... $ 3.91 $ 2.99 $ 1.76
Earnings per share attributable to Quest Diagnostics’ common
stockholders – diluted:
Income from continuing operations ..................................... $ 3.88 $ 3.22 $ 2.84
Loss from discontinued operations...................................... (0.01) (0.26) (1.10)
Net income ........................................................... $ 3.87 $ 2.96 $ 1.74
Dividends per common share ......................................... $ 0.40 $ 0.40 $ 0.40
The accompanying notes are an integral part of these statements.
F-3