Quest Diagnostics 2009 Annual Report Download - page 112
Download and view the complete annual report
Please find page 112 of the 2009 Quest Diagnostics annual report below. You can navigate through the pages in the report by either clicking on the pages listed below, or by using the keyword search tool below to find specific information within the annual report.-
 1
1 -
2
-
3
-
4
-
5
-
6
-
7
-
8
-
9
-
10
-
11
-
12
-
13
-
14
-
15
-
16
-
17
-
18
-
19
-
20
-
21
-
22
-
23
-
24
-
25
-
26
-
27
-
28
-
29
-
30
-
31
-
32
-
33
-
34
-
35
-
36
-
37
-
38
-
39
-
40
-
41
-
42
-
43
-
44
-
45
-
46
-
47
-
48
-
49
-
50
-
51
-
52
-
53
-
54
-
55
-
56
-
57
-
58
-
59
-
60
-
61
-
62
-
63
-
64
-
65
-
66
-
67
-
68
-
69
-
70
-
71
-
72
-
73
-
74
-
75
-
76
-
77
-
78
-
79
-
80
-
81
-
82
-
83
-
84
-
85
-
86
-
87
-
88
-
89
-
90
-
91
-
92
-
93
-
94
-
95
-
96
-
97
-
98
-
99
-
100
-
101
-
 102
102 -
 103
103 -
 104
104 -
 105
105 -
 106
106 -
 107
107 -
 108
108 -
 109
109 -
 110
110 -
 111
111 -
 112
112 -
 113
113 -
 114
114 -
 115
115 -
 116
116 -
 117
117 -
 118
118 -
 119
119 -
 120
120 -
 121
121 -
 122
122 -
123
-
124
 |
 |

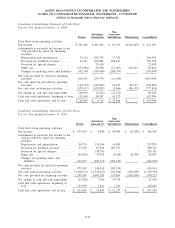
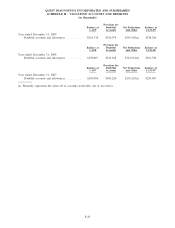
Condensed Consolidating Statement of Cash Flows
For the Year Ended December 31, 2008
Parent
Subsidiary
Guarantors
Non-
Guarantor
Subsidiaries Eliminations Consolidated
Cash flows from operating activities:
Net income ................................. $ 581,490 $ 291,203 $ 66,747 $(326,245) $ 613,195
Adjustments to reconcile net income to net
cash provided by (used in) operating
activities:
Depreciation and amortization ............. 53,116 193,975 17,502 - 264,593
Provision for doubtful accounts ............ 11,261 106,804 208,163 - 326,228
Provision for special charges .............. - 72,650 - - 72,650
Other, net ................................ (279,394) 56,698 (21,067) 326,245 82,482
Changes in operating assets and liabilities . . 462,768 (470,560) (288,307) - (296,099)
Net cash provided by (used in) operating
activities. ................................. 829,241 250,770 (16,962) - 1,063,049
Net cash (used in) provided by investing
activities. ................................. (144,149) (149,004) 14,137 80,133 (198,883)
Net cash used in financing activities . . . ...... (578,137) (109,898) (9,646) (80,133) (777,814)
Net change in cash and cash equivalents ..... 106,955 (8,132) (12,471) - 86,352
Cash and cash equivalents, beginning of year . 111,610 14,847 41,137 - 167,594
Cash and cash equivalents, end of year. ...... $ 218,565 $ 6,715 $ 28,666 $ - $ 253,946
Condensed Consolidating Statement of Cash Flows
For the Year Ended December 31, 2007
Parent
Subsidiary
Guarantors
Non-
Guarantor
Subsidiaries Eliminations Consolidated
Cash flows from operating activities:
Net income. . ............................. $ 339,939 $ 9,950 $ 98,409 $ (81,849) $ 366,449
Adjustments to reconcile net income to net
cash provided by (used in) operating
activities:
Depreciation and amortization ........... 50,726 170,344 16,809 - 237,879
Provision for doubtful accounts.......... 11,219 83,240 205,767 - 300,226
Provision for special charges . ........... - 238,781 - - 238,781
Other, net . ............................. (64,298) 37,970 (5,914) 81,849 49,607
Changes in operating assets and
liabilities............................. 634,379 (200,171) (700,226) - (266,018)
Net cash provided by (used in) operating
activities . . ............................. 971,965 340,114 (385,155) - 926,924
Net cash used in investing activities ....... (2,200,512) (1,334,217) (316,554) 2,092,090 (1,759,193)
Net cash provided by financing activities . . 1,205,559 1,001,289 735,465 (2,092,090) 850,223
Net change in cash and cash equivalents . . . (22,988) 7,186 33,756 - 17,954
Cash and cash equivalents, beginning of
year ................................... 134,598 7,661 7,381 - 149,640
Cash and cash equivalents, end of year . . . . $ 111,610 $ 14,847 $ 41,137 $ - $ 167,594
F-42
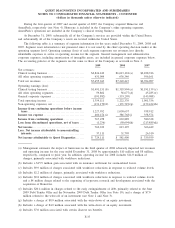
QUEST DIAGNOSTICS INCORPORATED AND SUBSIDIARIES
NOTES TO CONSOLIDATED FINANCIAL STATEMENTS - CONTINUED
(dollars in thousands unless otherwise indicated)