Quest Diagnostics 2009 Annual Report Download - page 113
Download and view the complete annual report
Please find page 113 of the 2009 Quest Diagnostics annual report below. You can navigate through the pages in the report by either clicking on the pages listed below, or by using the keyword search tool below to find specific information within the annual report.-
 1
1 -
2
-
3
-
4
-
5
-
6
-
7
-
8
-
9
-
10
-
11
-
12
-
13
-
14
-
15
-
16
-
17
-
18
-
19
-
20
-
21
-
22
-
23
-
24
-
25
-
26
-
27
-
28
-
29
-
30
-
31
-
32
-
33
-
34
-
35
-
36
-
37
-
38
-
39
-
40
-
41
-
42
-
43
-
44
-
45
-
46
-
47
-
48
-
49
-
50
-
51
-
52
-
53
-
54
-
55
-
56
-
57
-
58
-
59
-
60
-
61
-
62
-
63
-
64
-
65
-
66
-
67
-
68
-
69
-
70
-
71
-
72
-
73
-
74
-
75
-
76
-
77
-
78
-
79
-
80
-
81
-
82
-
83
-
84
-
85
-
86
-
87
-
88
-
89
-
90
-
91
-
92
-
93
-
94
-
95
-
96
-
97
-
98
-
99
-
100
-
101
-
102
-
 103
103 -
 104
104 -
 105
105 -
 106
106 -
 107
107 -
 108
108 -
 109
109 -
 110
110 -
 111
111 -
 112
112 -
 113
113 -
 114
114 -
 115
115 -
 116
116 -
 117
117 -
 118
118 -
 119
119 -
 120
120 -
 121
121 -
 122
122 -
 123
123 -
124
 |
 |

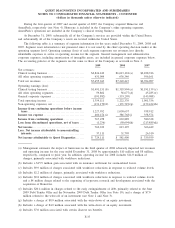
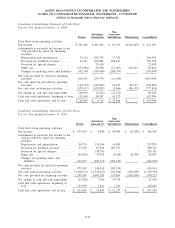
QUEST DIAGNOSTICS INCORPORATED AND SUBSIDIARIES
(in thousands, except per share data)
Quarterly Operating Results (unaudited)
First
Quarter
Second
Quarter
Third
Quarter
Fourth
Quarter
Total
Year
2009 (a)
Net revenues . . . . . ........................... $1,808,006 $1,901,818 $1,897,146 $1,848,273 $7,455,243
Gross profit . . . . . . ........................... 754,517 801,606 799,611 778,034 3,133,768
Income from continuing operations ........... 177,327 198,281(b)(c)(d) 201,092(e) 190,758(f)(g) 767,458
(Loss) income from discontinued operations,
net of taxes . . . . ........................... (1,671) 88 543 (196) (1,236)
Net income . . . . . . ........................... 175,656 198,369 201,635 190,562 766,222
Less: Net income attributable to
noncontrolling interests . ................... 8,554 10,169 9,416 8,972 37,111
Net income attributable to Quest Diagnostics. . $ 167,102 $ 188,200 $ 192,219 $ 181,590 $ 729,111
Amounts attributable to Quest Diagnostics’
stockholders:
Income from continuing operations ........... $ 168,773 $ 188,112 $ 191,676 $ 181,786 $ 730,347
(Loss) income from discontinued operations,
net of taxes . . . . ........................... (1,671) 88 543 (196) (1,236)
Net income . . . . . . ........................... $ 167,102 $ 188,200 $ 192,219 $ 181,590 $ 729,111
Earnings per share attributable to Quest
Diagnostics’ stockholders – basic:
Income from continuing operations ........... $ 0.89 $ 1.01 $ 1.03 $ 0.98 $ 3.92
Loss from discontinued operations . ........... (0.01) - - - (0.01)
Net income . . . . . . ........................... $ 0.88 $ 1.01 $ 1.03 $ 0.98 $ 3.91
Earnings per share attributable to Quest
Diagnostics’ stockholders – diluted:
Income from continuing operations ........... $ 0.89 $ 1.00 $ 1.02 $ 0.97 $ 3.88
Loss from discontinued operations . ........... (0.01) - - - (0.01)
Net income . . . . . . ........................... $ 0.88 $ 1.00 $ 1.02 $ 0.97 $ 3.87
First
Quarter
Second
Quarter
Third
Quarter
Fourth
Quarter
Total
Year
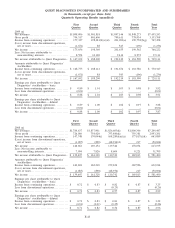
2008 (a)
Net revenues ................................ $1,784,637 $1,837,901 $1,826,603(h) $1,800,306 $7,249,447
Gross profit . ................................ 726,010 754,420 753,480(h) 759,381 2,993,291
Income from continuing operations . . ......... 147,748 170,044(i) 168,280(h)(i)(j) 177,817(i)(k) 663,889
(Loss) income from discontinued operations,
net of taxes. . . ............................ (1,087) (890) (48,934)(l) 217 (50,694)
Net income . ................................ 146,661 169,154 119,346 178,034 613,195
Less: Net income attributable to
noncontrolling interests .................... 7,054 7,826 8,604 8,221 31,705
Net income attributable to Quest Diagnostics . $ 139,607 $ 161,328 $ 110,742 $ 169,813 $ 581,490
Amounts attributable to Quest Diagnostics’
stockholders:
Income from continuing operations . . ......... 140,694 162,218 159,676 169,596 632,184
(Loss) income from discontinued operations,
net of taxes. . . ............................ (1,087) (890) (48,934) 217 (50,694)
Net income . ................................ $ 139,607 $ 161,328 $ 110,742 $ 169,813 $ 581,490
Earnings per share attributable to Quest
Diagnostics’ stockholders – basic:
Income from continuing operations . . ......... $ 0.72 $ 0.83 $ 0.82 $ 0.87 $ 3.25
Loss from discontinued operations. . . ......... - - (0.25) - (0.26)
Net income . ................................ $ 0.72 $ 0.83 $ 0.57 $ 0.87 $ 2.99
Earnings per share attributable to Quest
Diagnostics’ stockholders – diluted:
Income from continuing operations . . ......... $ 0.72 $ 0.83 $ 0.81 $ 0.87 $ 3.22
Loss from discontinued operations. . . ......... (0.01) (0.01) (0.25) - (0.26)
Net income . ................................ $ 0.71 $ 0.82 $ 0.56 $ 0.87 $ 2.96
F-43