Quest Diagnostics 2009 Annual Report Download - page 50
Download and view the complete annual report
Please find page 50 of the 2009 Quest Diagnostics annual report below. You can navigate through the pages in the report by either clicking on the pages listed below, or by using the keyword search tool below to find specific information within the annual report.-
 1
1 -
2
-
3
-
4
-
5
-
6
-
7
-
8
-
9
-
10
-
11
-
12
-
13
-
14
-
15
-
16
-
17
-
18
-
19
-
20
-
21
-
22
-
23
-
24
-
25
-
26
-
27
-
28
-
29
-
30
-
31
-
32
-
33
-
34
-
35
-
36
-
37
-
38
-
39
-
 40
40 -
 41
41 -
 42
42 -
 43
43 -
 44
44 -
 45
45 -
 46
46 -
 47
47 -
 48
48 -
 49
49 -
 50
50 -
 51
51 -
 52
52 -
 53
53 -
 54
54 -
 55
55 -
 56
56 -
 57
57 -
 58
58 -
 59
59 -
 60
60 -
61
-
62
-
63
-
64
-
65
-
66
-
67
-
68
-
69
-
70
-
71
-
72
-
73
-
74
-
75
-
76
-
77
-
78
-
79
-
80
-
81
-
82
-
83
-
84
-
85
-
86
-
87
-
88
-
89
-
90
-
91
-
92
-
93
-
94
-
95
-
96
-
97
-
98
-
99
-
100
-
101
-
102
-
103
-
104
-
105
-
106
-
107
-
108
-
109
-
110
-
111
-
112
-
113
-
114
-
115
-
116
-
117
-
118
-
119
-
120
-
121
-
122
-
123
-
124
 |
 |

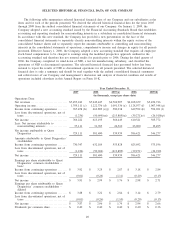
SELECTED HISTORICAL FINANCIAL DATA OF OUR COMPANY
The following table summarizes selected historical financial data of our Company and our subsidiaries at the
dates and for each of the periods presented. We derived the selected historical financial data for the years 2005
through 2009 from the audited consolidated financial statements of our Company. On January 1, 2009, the
Company adopted a new accounting standard issued by the Financial Accounting Standards Board that establishes
accounting and reporting standards for noncontrolling interests in a subsidiary in consolidated financial statements.
In accordance with this new standard, the Company has provided a new presentation on the face of the
consolidated financial statements to separately classify noncontrolling interests within the equity section of the
consolidated balance sheets and to separately report the amounts attributable to controlling and noncontrolling
interests in the consolidated statements of operations, comprehensive income and changes in equity for all periods
presented. Effective January 1, 2006, the Company adopted a new accounting standard that requires all employee
stock-based compensation to be charged to earnings using the modified prospective approach outlined in the
accounting standard and therefore has not restated results for periods prior to 2006. During the third quarter of
2006, the Company completed its wind down of NID, a test kit manufacturing subsidiary, and classified the
operations of NID as discontinued operations. The selected historical financial data presented below has been
restated to report the results of NID as discontinued operations for all periods presented. The selected historical
financial data is only a summary and should be read together with the audited consolidated financial statements
and related notes of our Company and management’s discussion and analysis of financial condition and results of
operations included elsewhere in this Annual Report on Form 10-K.
2009 2008 2007(a) 2006 2005(b)
Year Ended December 31,
(in thousands, except per share data)
Operations Data:
Net revenues ............................. $7,455,243 $7,249,447 $6,704,907 $6,268,659 $5,456,726
Operating income. . ....................... 1,359,111 (c) 1,222,376 (d) 1,091,336 (e) 1,128,077 (f) 1,007,548 (g)
Income from continuing operations ........ 767,458 (h) 663,889 (i)(j) 580,338 649,592 (k) 592,691 (l)
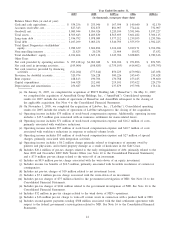
Loss from discontinued operations, net of
taxes . . ................................ (1,236) (50,694)(m) (213,889)(n) (39,271)(o) (26,919)(p)
Net income .............................. 766,222 613,195 366,449 610,321 565,772
Less: Net income attributable to
noncontrolling interests . . . .............. 37,111 31,705 26,510 23,900 19,495
Net income attributable to Quest
Diagnostics ............................ 729,111 581,490 339,939 586,421 546,277
Amounts attributable to Quest Diagnostics’
stockholders:
Income from continuing operations ........ 730,347 632,184 553,828 625,692 573,196
Loss from discontinued operations, net of
taxes . . ................................ (1,236) (50,694) (213,889) (39,271) (26,919)
Net income .............................. 729,111 581,490 339,939 586,421 546,277
Earnings per share attributable to Quest
Diagnostics’ common stockholders –
basic:
Income from continuing operations ........ $ 3.92 $ 3.25 $ 2.87 $ 3.18 $ 2.84
Loss from discontinued operations, net of
taxes . . ................................ (0.01) (0.26) (1.11) (0.20) (0.13)
Net income .............................. $ 3.91 $ 2.99 $ 1.76 $ 2.98 $ 2.71
Earnings per share attributable to Quest
Diagnostics’ common stockholders –
diluted:
Income from continuing operations ........ $ 3.88 $ 3.22 $ 2.84 $ 3.14 $ 2.79
Loss from discontinued operations, net of
taxes . . ................................ (0.01) (0.26) (1.10) (0.20) (0.13)
Net income .............................. $ 3.87 $ 2.96 $ 1.74 $ 2.94 $ 2.66
Dividends per common share.............. $ 0.40 $ 0.40 $ 0.40 $ 0.40 $ 0.36
40