Pizza Hut 2005 Annual Report Download - page 77
Download and view the complete annual report
Please find page 77 of the 2005 Pizza Hut annual report below. You can navigate through the pages in the report by either clicking on the pages listed below, or by using the keyword search tool below to find specific information within the annual report.-
 1
1 -
2
-
3
-
4
-
5
-
6
-
7
-
8
-
9
-
10
-
11
-
12
-
13
-
14
-
15
-
16
-
17
-
18
-
19
-
20
-
21
-
22
-
23
-
24
-
25
-
26
-
27
-
28
-
29
-
30
-
31
-
32
-
33
-
34
-
35
-
36
-
37
-
38
-
39
-
40
-
41
-
42
-
43
-
44
-
45
-
46
-
47
-
48
-
49
-
50
-
51
-
52
-
53
-
54
-
55
-
56
-
57
-
58
-
59
-
60
-
61
-
62
-
63
-
64
-
65
-
66
-
 67
67 -
 68
68 -
 69
69 -
 70
70 -
 71
71 -
 72
72 -
 73
73 -
 74
74 -
 75
75 -
 76
76 -
 77
77 -
 78
78 -
 79
79 -
 80
80 -
 81
81 -
 82
82
 |
 |

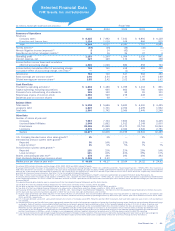
SelectedFinancialData
YUM!Brands,Inc.andSubsidiaries
(inmillions,exceptpershareandunitamounts) FiscalYear
2005 2004 2003 2002 2001
SummaryofOperations
Revenues
Companysales $ 8,225 $ 7,992 $ 7,441 $ 6,891 $ 6,138
Franchiseandlicensefees 1,124 1,019 939 866 815
Total 9,349 9,011 8,380 7,757 6,953
Facilityactions(a) (19) (26) (36) (32) (1)
Wrenchlitigationincome(expense)(b) 2 14 (42) — —
AmeriServeandother(charges)credits(c) 2 16 26 27 3
Operatingprofit 1,153 1,155 1,059 1,030 891
Interestexpense,net 127 129 173 172 158
Incomebeforeincometaxesandcumulative
effectofaccountingchange 1,026 1,026 886 858 733
Incomebeforecumulativeeffectofaccountingchange 762 740 618 583 492
Cumulativeeffectofaccountingchange,netoftax(d) — — (1) — —
Netincome 762 740 617 583 492
Basicearningspercommonshare(e) 2.66 2.54 2.10 1.97 1.68
Dilutedearningspercommonshare(e) 2.55 2.42 2.02 1.88 1.62
CashFlowData
Providedbyoperatingactivities(f)$ 1,238 $ 1,186 $ 1,099 $ 1,112 $ 851
Capitalspending,excludingacquisitions 609 645 663 760 636
Proceedsfromrefranchisingofrestaurants 145 140 92 81 111
Repurchasesharesofcommonstock 1,056 569 278 228 100
Dividendspaidoncommonshares 123 58 — — —
BalanceSheet
Totalassets $ 5,698 $ 5,696 $ 5,620 $ 5,400 $ 4,425
Long-termdebt 1,649 1,731 2,056 2,299 1,552
Totaldebt 1,860 1,742 2,066 2,445 2,248
OtherData
Numberofstoresatyearend
Company 7,587 7,743 7,854 7,526 6,435
UnconsolidatedAffiliates 1,648 1,662 1,512 2,148 2,000
Franchisees 22,666 21,858 21,471 20,724 19,263
Licensees 2,376 2,345 2,362 2,526 2,791
System 34,277 33,608 33,199 32,924 30,489
U.S.Companyblendedsamestoresalesgrowth(g) 4% 3% — 2% 1%
InternationalDivisionsystemsalesgrowth(h)
Reported 9% 14% 13% 6% —
Localcurrency(i) 6% 6% 5% 7% 7%
ChinaDivisionsystemsalesgrowth(h)
Reported 13% 23% 23% 25% 14%
Localcurrency(i) 11% 23% 23% 25% 17%
Sharesoutstandingatyearend(e) 278 290 292 294 293
Cashdividendsdeclaredpercommonshare $ 0.445 $ 0.30 — — —
Marketpricepershareatyearend(e)$ 46.88 $ 46.27 $ 33.64 $ 24.12 $ 24.62
Fiscalyear2005includes53weeksandfiscalyears2004,2003,2002and2001include52weeks.
Fiscalyear2005includestheimpactoftheadoptionofStatementofFinancialAccountingStandards(“SFAS”)No.123R(Revised2004),“ShareBasedPayment,”(“SFAS123R”).Thisresultedina
$38milliondecreaseinnetincome,oradecreaseof$0.13tobasicanddilutedearningspersharefor2005.IfSFAS123Rhadbeeneffectiveforprioryearspresented,reportedbasicanddiluted
earningspersharewouldhavedecreased$0.12and$0.12,$0.12and$0.12,$0.14and$0.13,and$0.13and$0.13persharefor2004,2003,2002,and2001,respectively,consistentwith
previouslydisclosedpro-formainformation.SeeNote2totheConsolidatedFinancialStatements.
FromMay7,2002,resultsincludeLongJohnSilver’s(“LJS”)andA&WAll-AmericanFoodRestaurants(“A&W”),whichwereaddedwhenweacquiredYorkshireGlobalRestaurants,Inc.
Fiscalyear2002includestheimpactoftheadoptionofSFASNo.142,“GoodwillandOtherIntangibleAssets”(“SFAS142”).Asaresultweceasedamortizationofgoodwillandindefinite-lived
assetsbeginningDecember30,2001.IfSFAS142hadbeeneffectivefor2001,reportednetincomewouldhaveincreased$26millionandbothbasicanddilutedearningspersharewouldhave
increased$0.09.
TheselectedfinancialdatashouldbereadinconjunctionwiththeConsolidatedFinancialStatementsandtheNotesthereto.
(a) SeeNote4totheConsolidatedFinancialStatementsforadescriptionofFacilityactionsin2005,2004,and2003.
(b) SeeNote4andNote21totheConsolidatedFinancialStatementsforadescriptionofWrenchlitigationin2005,2004,and2003.
(c) SeeNote4totheConsolidatedFinancialStatementsforadescriptionofAmeriServeandothercharges(credits)in2005,2004,and2003.
(d) Fiscalyear2003includestheimpactoftheadoptionofSFASNo.143,“AccountingforAssetRetirementObligations.”SeeNote2totheConsolidatedFinancialStatementsforfurtherdiscussion.
(e) Pershareandshareamountshavebeenadjustedtoreflectthetwo-for-onestocksplitdistributedonJune17,2002.
(f) Allprioryearspresentedhavebeenadjustedforthereclassificationofdistributionsfromunconsolidatedaffiliatesfrominvestingactivitiestooperatingactivitiesinaccordancewith
SFASNo.95,“StatementofCashFlows.”Thesereclassificationsincreasednetcashprovidedbyoperatingactivitiesby$55million,$46million,$24millionand$19millionfor2004,2003,
2002,and2001,respectively.
(g)U.S.Companyblendedsame-storesalesgrowthincludestheresultsofCompanyownedKFC,PizzaHutandTacoBellrestaurantsthathavebeenopenoneyearormore.LJSandA&Ware
notincluded.
(h) InternationalDivisionandChinaDivisionsystemsalesgrowthincludestheresultsofallrestaurantsregardlessofownership,includingCompanyowned,franchise,unconsolidatedaffiliateandlicense
restaurants.Salesoffranchise,unconsolidatedaffiliateandlicenserestaurantsgeneratefranchiseandlicensefeesfortheCompany(typicallyatarateof4%to6%ofsales).Franchise,unconsoli-
datedaffiliateandlicenserestaurantsalesarenotincludedinCompanysaleswepresentontheConsolidatedStatementsofIncome;however,thefeesareincludedintheCompany’srevenues.
Webelievesystemsalesgrowthisusefultoinvestorsasasignificantindicatoroftheoverallstrengthofourbusinessasitincorporatesallourrevenuedrivers,Companyandfranchisesamestore
salesaswellasnetunitdevelopment.Additionally,aspreviouslynoted,webeganreportinginformationforourinternationalbusinessintwoseparateoperatingsegments(theInternationalDivision
andtheChinaDivision)in2005asaresultofchangesinourmanagementstructure.Segmentinformationforperiodspriorto2005hasbeenrestatedtoreflectthisreporting.
(i) Localcurrencyrepresentsthepercentagechangeexcludingtheimpactofforeigncurrencytranslation.Theseamountsarederivedbytranslatingcurrentyearresultsatprioryearaverageexchange
rates.Webelievetheeliminationoftheforeigncurrencytranslationimpactprovidesbetteryear-to-yearcomparabilitywithoutthedistortionofforeigncurrencyfluctuations.
Yum!Brands,Inc. | 81.