Pizza Hut 2005 Annual Report Download - page 33
Download and view the complete annual report
Please find page 33 of the 2005 Pizza Hut annual report below. You can navigate through the pages in the report by either clicking on the pages listed below, or by using the keyword search tool below to find specific information within the annual report.-
 1
1 -
2
-
3
-
4
-
5
-
6
-
7
-
8
-
9
-
10
-
11
-
12
-
13
-
14
-
15
-
16
-
17
-
18
-
19
-
20
-
21
-
22
-
 23
23 -
 24
24 -
 25
25 -
 26
26 -
 27
27 -
 28
28 -
 29
29 -
 30
30 -
 31
31 -
 32
32 -
 33
33 -
 34
34 -
 35
35 -
 36
36 -
 37
37 -
 38
38 -
 39
39 -
 40
40 -
 41
41 -
 42
42 -
 43
43 -
44
-
45
-
46
-
47
-
48
-
49
-
50
-
51
-
52
-
53
-
54
-
55
-
56
-
57
-
58
-
59
-
60
-
61
-
62
-
63
-
64
-
65
-
66
-
67
-
68
-
69
-
70
-
71
-
72
-
73
-
74
-
75
-
76
-
77
-
78
-
79
-
80
-
81
-
82
 |
 |

CommodityInflation Highercommoditycosts,particularlyin
cheeseandmeatprices,negativelyimpactedU.S.restaurant
marginsasapercentageofsalesbyapproximately160basis
pointsfortheyearended2004versustheyearended2003.
WrenchLitigation Werecordedincomeof$2millionand
$14millionin2005and2004,respectively,andexpense
of$42millionin2003.SeeNote4foradiscussionofthe
Wrenchlitigation.
AmeriServe and Other Charges (Credits) We recorded
incomeof$2million,$16millionand$26millionin2005,
2004 and 2003, respectively. See Note 4for a detailed
discussionofAmeriServeandothercharges(credits).
Store Portfolio Strategy From time to time we sell
Company restaurants to existing and new franchisees
wheregeographicsynergiescanbeobtainedorwheretheir
expertisecangenerallybeleveragedtoimproveouroverall
operatingperformance,whileretainingCompanyownership
ofkeyU.S.andinternationalmarkets.Suchrefranchisings
reduceourreportedrevenuesandrestaurantprofitsand
increasetheimportanceofsystemsalesgrowthasakey
performancemeasure.
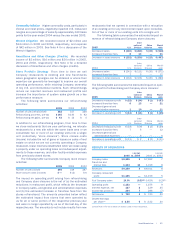
The following table summarizes our refranchising
activities:
2005 2004 2003
Numberofunitsrefranchised 382 317 228
Refranchisingproceeds,pre-tax $145 $140 $ 92
Refranchisingnetgains,pre-tax $ 43 $ 12 $ 4
Inadditiontoourrefranchisingprogram,fromtimetotime
wecloserestaurantsthatarepoorperforming,werelocate
restaurantstoanewsitewithinthesametradeareaorwe
consolidatetwoormoreofourexistingunitsintoasingle
unit (collectively “store closures”). Store closure costs
(income)includesthenetofgainsorlossesonsalesofreal
estateonwhichwearenotcurrentlyoperatingaCompany
restaurant,leasereservesestablishedwhenweceaseusing
apropertyunderanoperatingleaseandsubsequentadjust-
mentstothosereserves,andotherfacility-relatedexpenses
frompreviouslyclosedstores.
ThefollowingtablesummarizesCompanystoreclosure
activities:
2005 2004 2003
Numberofunitsclosed 246 319 287
Storeclosurecosts(income) $— $(3) $6
The impact on operatingprofit arising from refranchising
andCompanystoreclosuresisthenetof(a)theestimated
reductionsinrestaurantprofit,whichreflectsthedecrease
inCompanysales,andgeneralandadministrativeexpenses
and(b)theestimatedincreaseinfranchisefeesfromthe
storesrefranchised.Theamountspresentedbelowreflect
the estimated impactfrom stores thatwere operated by
usforallorsomeportionoftherespectivepreviousyear
andwerenolongeroperatedbyusasofthelastdayofthe
respectiveyear.Theamountsdonotincluderesultsfromnew
restaurantsthatweopenedinconnectionwitharelocation
ofanexistingunitoranyincrementalimpactuponconsolida-
tionoftwoormoreofourexistingunitsintoasingleunit.
Thefollowingtablesummarizestheestimatedimpacton
revenueofrefranchisingandCompanystoreclosures:
Inter-
national China World-
2005 U.S. Division Division wide
Decreasedsales $(240) $(263) $(15) $(518)
Increasedfranchisefees 8 13 — 21
Decreaseintotalrevenues $(232) $(250) $(15) $(497)
Inter-
national China World-
2004 U.S. Division Division wide
Decreasedsales $(241) $(111) $(20) $(372)
Increasedfranchisefees 7 5 — 12
Decreaseintotalrevenues $(234) $(106) $(20) $(360)
Thefollowingtablesummarizestheestimatedimpactonoper-
atingprofitofrefranchisingandCompanystoreclosures:
Inter-
national China World-
2005 U.S. Division Division wide
Decreasedrestaurantprofit $(22) $(34) $(1) $(57)
Increasedfranchisefees 8 13 — 21
Decreasedgeneraland
administrativeexpenses 1 10 — 11
Decreaseinoperatingprofit $(13) $(11) $(1) $(25)
Inter-
national China World-
2004 U.S. Division Division wide
Decreasedrestaurantprofit $(18) $(9) $(2) $(29)
Increasedfranchisefees 7 5 — 12
Decreasedgeneraland
administrativeexpenses — 6 — 6
Decreaseinoperatingprofit $(11) $ 2 $(2) $(11)
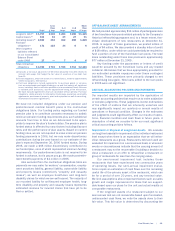
RESULTSOFOPERATIONS
%B/(W) %B/(W)
2005 vs.2004 2004 vs.2003
Companysales $8,225 3 $7,992 7
Franchiseand
licensefees 1,124 10 1,019 8
Revenues $9,349 4 $9,011 8
Companyrestaurant
profit $1,155 — $1,159 5
%ofCompanysales 14.0% (0.5)ppts.14.5% (0.3)ppts.
Operatingprofit 1,153 — 1,155 9
Interestexpense,net 127 2 129 25
Incometaxprovision 264 7 286 (7)
Netincome $ 762 3 $ 740 20
Dilutedearnings
pershare(a)$ 2.55 5 $ 2.42 20
(a)SeeNote3forthenumberofsharesusedinthiscalculation.
Yum!Brands,Inc. | 37.