Pizza Hut 2005 Annual Report Download - page 39
Download and view the complete annual report
Please find page 39 of the 2005 Pizza Hut annual report below. You can navigate through the pages in the report by either clicking on the pages listed below, or by using the keyword search tool below to find specific information within the annual report.-
 1
1 -
2
-
3
-
4
-
5
-
6
-
7
-
8
-
9
-
10
-
11
-
12
-
13
-
14
-
15
-
16
-
17
-
18
-
19
-
20
-
21
-
22
-
23
-
24
-
25
-
26
-
27
-
28
-
 29
29 -
 30
30 -
 31
31 -
 32
32 -
 33
33 -
 34
34 -
 35
35 -
 36
36 -
 37
37 -
 38
38 -
 39
39 -
 40
40 -
 41
41 -
 42
42 -
 43
43 -
 44
44 -
 45
45 -
 46
46 -
 47
47 -
 48
48 -
 49
49 -
50
-
51
-
52
-
53
-
54
-
55
-
56
-
57
-
58
-
59
-
60
-
61
-
62
-
63
-
64
-
65
-
66
-
67
-
68
-
69
-
70
-
71
-
72
-
73
-
74
-
75
-
76
-
77
-
78
-
79
-
80
-
81
-
82
 |
 |

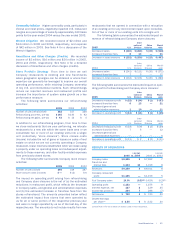
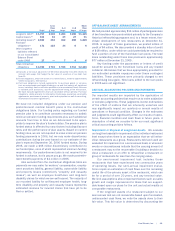
INCOMETAXES
2005 2004 2003
Reported
Incometaxes $264 $286 $268
Effectivetaxrate 25.8% 27.9% 30.2%
ThereconciliationofincometaxescalculatedattheU.S.federal
taxstatutoryratetooureffectivetaxrateissetforthbelow:
200520042003
U.S.federalstatutoryrate 35.0% 35.0% 35.0%
Stateincometax,netof
federaltaxbenefit 1.6 1.3 1.8
ForeignandU.S.taxeffects
attributabletoforeignoperations (6.7) (6.3) (3.6)
Adjustmentstoreservesand
prioryears (1.3) (6.7) (1.7)
Repatriationofforeignearnings 2.0 0.5 —
Non-recurringforeigntaxcredit
adjustment (2.9) — (4.1)
Valuationallowanceadditions
(reversals) (1.4) 4.2 2.8
Other,net (0.5) (0.1) —
Effectiveincometaxrate 25.8% 27.9% 30.2%
Income taxes and the effectivetax rate as shown above
reflecttaxonallamountsincludedinourresultsofopera-
tions except for the income tax benefit of approximately
$1milliononthe$2millioncumulativeeffectadjustment
recordedintheyearendedDecember27,2003duetothe
adoptionofSFAS143.
The2005effectivetaxratedecreased2.1percentage
pointsto25.8%.Thedecreaseintheeffectivetaxratewas
drivenbyanumberoffactors,includingtheimpactofyear
overyearvaluationallowancesadjustmentsaswellasthe
recognitionofcertainforeigntaxcreditsthatwewereable
tosubstantiatein2005.Thedecreasewaspartiallyoffset
bytheimpactofyearoveryearadjustmentstoreservesand
prioryearsandtaxprovidedonforeignearningswhichwere
repatriatedtotheU.S.in2005.
The2004effectivetaxratedecreased2.3percentage
points to 27.9%. The decrease in the effective tax rate
wasdriven bya numberoffactors, includingthereversal
ofreservesinthecurrentyearassociatedwithauditsthat
weresettledaswellastheeffectsofcertaininternational
taxplanningstrategiesimplementedin2004.Thedecrease
waspartiallyoffsetbytheimpactoflappingthebenefitin
2003ofamendingcertainpriorU.S.incometaxreturnsto
claimcreditforforeigntaxespaidinprioryearsaswellas
therecognitionin2004ofvaluationallowancesforcertain
deferredtaxassetswhoserealizationisnolongerconsid-
eredmorelikelythannot.
Adjustments to reser ves and prior years include the
effectsofthereconciliationofincometaxamountsrecorded
in our Consolidated Statements of Income to amounts
reflectedonourtaxreturns,includinganyadjustmentstothe
ConsolidatedBalanceSheets.Adjustmentstoreservesand
prioryearsalsoincludeschangesintaxreservesestablished
forpotentialexposurewemayincurifataxingauthoritytakes
apositiononamattercontrarytoourposition.Weevaluate
thesereserves,includinginterestthereon,onaquarterly
basistoinsurethattheyhavebeenappropriatelyadjusted
forevents,includingauditsettlements,thatwebelievemay
impactourexposure.
CONSOLIDATEDCASHFLOWS
Netcashprovidedbyoperatingactivitieswas$1,238million
compared to $1,186million in 2004. The increase was
drivenprimarilybyanincreaseinnetincome,includingthe
non-cashimpactoftheadoptionofSFAS123R,andlower
incometaxpaymentsin2005,partiallyoffsetbytheimpact
of excess taxbenefits classified in financing activities in
2005pursuanttotheadoptionofSFAS123R.
In2004,netcashprovidedbyoperatingactivitieswas
$1,186million compared to $1,099millionin2003.The
increasewasprimarilydrivenbyanincreaseinnetincome
andadecreaseintheamountofvoluntarycontributionsto
ourfundedpensionplancomparedto2003,partiallyoffset
byhigherincometaxpaymentsin2004.
Netcashusedininvestingactivitieswas$345million
versus $541million in 2004. The decrease was driven
primarily by lower acquisitions of restaurants from fran-
chiseesandcapitalspending,theimpactofthetimingof
purchases and sales of short-term investments, higher
proceedsfrom thesaleof property,plantandequipment
versus2004andtheproceedsfromthesaleofourPoland/
CzechRepublicunconsolidatedaffiliate.
In 2004, net cash used in investing activities was
$541millionversus $565million in 2003.The decrease
wasprimarilydrivenbyhigherproceedsfromrefranchisingof
restaurantsandlowercapitalspendingcomparedto2003,
partiallyoffsetbytheimpactofthetimingofpurchasesand
salesofshort–terminvestments.
Netcashusedinfinancingactivitieswas$832million
versus $779million in 2004. The increase was driven
primarilybyhighersharerepurchases,partiallyoffsetbynet
debtborrowingsin2005versusnetdebtrepaymentsin2004
andtheimpactofexcesstaxbenefitsclassifiedinfinancing
activitiesin2005pursuanttotheadoptionofSFAS123R.
In 2004, net cash used in financing activities was
$779million versus $475million in 2003. The increase
in2004wasprimarilydrivenbyhighersharerepurchases,
highernetdebtrepaymentsandthepaymentoftwoquar-
terlydividends,partiallyoffsetbyhigherproceedsfromstock
optionexercises.
Yum!Brands,Inc. | 43.