Pizza Hut 2005 Annual Report Download - page 51
Download and view the complete annual report
Please find page 51 of the 2005 Pizza Hut annual report below. You can navigate through the pages in the report by either clicking on the pages listed below, or by using the keyword search tool below to find specific information within the annual report.-
 1
1 -
2
-
3
-
4
-
5
-
6
-
7
-
8
-
9
-
10
-
11
-
12
-
13
-
14
-
15
-
16
-
17
-
18
-
19
-
20
-
21
-
22
-
23
-
24
-
25
-
26
-
27
-
28
-
29
-
30
-
31
-
32
-
33
-
34
-
35
-
36
-
37
-
38
-
39
-
40
-
 41
41 -
 42
42 -
 43
43 -
 44
44 -
 45
45 -
 46
46 -
 47
47 -
 48
48 -
 49
49 -
 50
50 -
 51
51 -
 52
52 -
 53
53 -
 54
54 -
 55
55 -
 56
56 -
 57
57 -
 58
58 -
 59
59 -
 60
60 -
 61
61 -
62
-
63
-
64
-
65
-
66
-
67
-
68
-
69
-
70
-
71
-
72
-
73
-
74
-
75
-
76
-
77
-
78
-
79
-
80
-
81
-
82
 |
 |

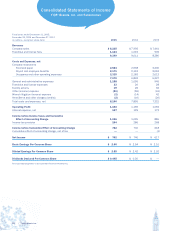
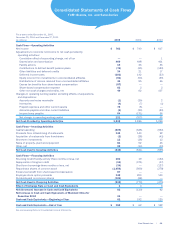
FiscalyearsendedDecember31,2005,
December25,2004andDecember27,2003
(inmillions) 2005 2004 2003
CashFlows—OperatingActivities
Netincome $ 762 $ 740 $ 617
Adjustmentstoreconcilenetincometonetcashprovidedby
operatingactivities:
Cumulativeeffectofaccountingchange,netoftax — — 1
Depreciationandamortization 469 448 401
Facilityactions 19 26 36
Contributionstodefinedbenefitpensionplans (74) (55) (132)
Otherliabilitiesanddeferredcredits 34 21 17
Deferredincometaxes (101) 142 (23)
Equityincomefrominvestmentsinunconsolidatedaffiliates (51) (54) (39)
Distributionsofincomereceivedfromunconsolidatedaffiliates 44 55 46
Excesstaxbenefitsfromshare-basedcompensation (87) — —
Share-basedcompensationexpense 62 3 3
Othernon-cashchargesandcredits,net 40 62 107
Changesinoperatingworkingcapital,excludingeffectsofacquisitions
anddispositions:
Accountsandnotesreceivable (1) (39) 2
Inventories (4) (7) (1)
Prepaidexpensesandothercurrentassets 78 (5) —
Accountspayableandothercurrentliabilities (6) (20) (32)
Incometaxespayable 54 (131) 96
Netchangeinoperatingworkingcapital 121 (202) 65
NetCashProvidedbyOperatingActivities 1,238 1,186 1,099
CashFlows—InvestingActivities
Capitalspending (609) (645) (663)
Proceedsfromrefranchisingofrestaurants 145 140 92
Acquisitionofrestaurantsfromfranchisees (2) (38) (41)
Short-terminvestments 12 (36) 13
Salesofproperty,plantandequipment 81 52 46
Other,net 28 (14) (12)
NetCashUsedinInvestingActivities (345) (541) (565)
CashFlows—FinancingActivities
RevolvingCreditFacilityactivitythreemonthsorless,net 160 19 (153)
Repaymentsoflong-termdebt (14) (371) (17)
Short-termborrowings-threemonthsorless,net (34) — (137)
Repurchasesharesofcommonstock (1,056) (569) (278)
Excesstaxbenefitfromshare-basedcompensation 87 — —
Employeestockoptionproceeds 148 200 110
Dividendspaidoncommonshares (123) (58) —
NetCashUsedinFinancingActivities (832) (779) (475)
EffectofExchangeRateonCashandCashEquivalents 1 4 3
Net(Decrease)IncreaseinCashandCashEquivalents 62 (130) 62
NetIncreaseinCashandCashEquivalentsofMainlandChinafor
December2004 34 — —
CashandCashEquivalents—BeginningofYear 62 192 130
CashandCashEquivalents—EndofYear$ 158 $ 62 $ 192
SeeaccompanyingNotestoConsolidatedFinancialStatements.
ConsolidatedStatementsofCashFlows
YUM!Brands,Inc.andSubsidiaries
Yum!Brands,Inc. | 55.