Pizza Hut 2005 Annual Report Download - page 26
Download and view the complete annual report
Please find page 26 of the 2005 Pizza Hut annual report below. You can navigate through the pages in the report by either clicking on the pages listed below, or by using the keyword search tool below to find specific information within the annual report.-
 1
1 -
2
-
3
-
4
-
5
-
6
-
7
-
8
-
9
-
10
-
11
-
12
-
13
-
14
-
15
-
 16
16 -
 17
17 -
 18
18 -
 19
19 -
 20
20 -
 21
21 -
 22
22 -
 23
23 -
 24
24 -
 25
25 -
 26
26 -
 27
27 -
 28
28 -
 29
29 -
 30
30 -
 31
31 -
 32
32 -
 33
33 -
 34
34 -
 35
35 -
 36
36 -
37
-
38
-
39
-
40
-
41
-
42
-
43
-
44
-
45
-
46
-
47
-
48
-
49
-
50
-
51
-
52
-
53
-
54
-
55
-
56
-
57
-
58
-
59
-
60
-
61
-
62
-
63
-
64
-
65
-
66
-
67
-
68
-
69
-
70
-
71
-
72
-
73
-
74
-
75
-
76
-
77
-
78
-
79
-
80
-
81
-
82
 |
 |

ofresults
world
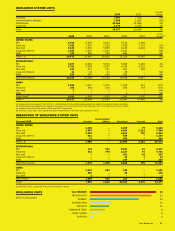
WORLDWIDESALES
5-Year
(inbillions) 2005 2004 2003 2002 2001 Growth(a)
UNITEDSTATES
KFC
Companysales $ 1.4 $ 1.4 $ 1.4 $ 1.4 $ 1.4 –
Franchiseesales(b) 3.8 3.6 3.5 3.4 3.3 5%
PIZZAHUT
Companysales $ 1.6 $ 1.6 $ 1.6 $ 1.5 $ 1.5 (2)%
Franchiseesales(b) 3.7 3.6 3.5 3.6 3.5 3%
TACOBELL
Companysales $ 1.8 $ 1.7 $ 1.6 $ 1.6 $ 1.4 6%
Franchiseesales(b) 4.4 4.0 3.8 3.6 3.5 3%
LJS(C)
Companysales $ 0.5 $ 0.5 $ 0.5 $ 0.3 – NM
Franchiseesales(b) 0.3 0.3 0.3 0.2 – NM
A&W(C)
Companysales $ – $ – $ – $ – – NM
Franchiseesales(b) 0.2 0.2 0.2 0.2 – NM
TOTALU.S.
Companysales $ 5.3 $ 5.2 $ 5.1 $ 4.8 $ 4.3 1%
Franchiseesales(b) 12.4 11.7 11.3 11.0 10.3 4%
INTERNATIONAL
KFC
Companysales $ 1.1 $ 1.0 $ 0.9 $ 0.9 $ 0.7 6%
Franchiseesales(b) 5.2 4.7 4.1 3.6 3.5 9%
PIZZAHUT
Companysales $ 0.6 $ 0.7 $ 0.5 $ 0.5 $ 0.5 3%
Franchiseesales(b) 3.0 2.6 2.4 2.2 2.0 9%
TACOBELL
Companysales $ – $ – $ – $ – $ – NM
Franchiseesales(b) 0.2 0.2 0.1 0.2 0.1 12%
LJS(C)
Companysales – – – – – NM
Franchiseesales(b) – – – – – NM
A&W(C)
Companysales – – – – – NM
Franchiseesales(b) 0.1 0.1 0.1 – – NM
TOTALINTERNATIONAL
Companysales $ 1.7 $ 1.7 $ 1.4 $ 1.4 $ 1.2 5%
Franchiseesales(b) 8.5 7.6 6.7 6.0 5.6 9%
CHINA
KFC
Companysales $ 1.0 $ 0.9 $ 0.8 $ 0.6 $ 0.5 21%
Franchiseesales(b) 0.7 0.6 0.5 0.3 0.3 13%
PIZZAHUT
Companysales $ 0.2 $ 0.2 $ 0.1 $ 0.1 $ 0.1 NM
Franchiseesales(b) – – – – – NM
TOTALCHINA
Companysales $ 1.2 $ 1.1 $ 0.9 $ 0.7 $ 0.6 24%
Franchiseesales(b) 0.7 0.6 0.5 0.3 0.3 13%
TOTALWORLDWIDE
Companysales $ 8.2 $ 8.0 $ 7.4 $ 6.9 $ 6.1 4%
Franchiseesales(b) 21.6 19.9 18.5 17.3 16.2 6%
(a)Compoundedannualgrowthrate;totalsforU.S.,InternationalandWorldwideexcludetheimpactofLongJohnSilver’sandA&W.
(b)Franchiseesalesrepresentsthecombinedestimatedsalesofunconsolidatedaffiliateandfranchiseandlicenserestaurants.Franchiseesales,whicharenotincluded
inourCompanysales,generatefranchiseandlicensefees(typicallyatratesbetween4%and6%)thatareincludedinourrevenues.
(c)BeginningMay7,2002,includesLongJohnSilver’sandA&W,whichwereaddedwhenweacquiredYorkshireGlobalRestaurants,Inc.
A
2005demonstratedthepowerofYum!’sglobalportfolio.In2005,wehadsalesissuesinChinaand
highU.S.commoditycostincreasesduringthefirsthalfoftheyear.Despitethis,EPSgrew13%.We
wereabletoachievetheseresultsbecauseofstrongTacoBellandKFCperformanceintheU.S.and
anotherstrongyearatYum!RestaurantsInternational.Wealsobenefitedfromstockrepurchases
thatweresupportedbythe$1billionofoperatingcashflowthatwegenerate.Wehavenowachieved
double-digitEPSgrowthforfourstraightyearsandareallworkinghardtobuilduponthisconsistent
recordofperformancetoshowtheworldthat“We’reNotYourOrdinaryRestaurantCompany.”
RickCarucci,CHIEFFINANCIALOFFICER,YUM!BRANDS,INC.
GlobalFacts