Pizza Hut 2005 Annual Report Download - page 67
Download and view the complete annual report
Please find page 67 of the 2005 Pizza Hut annual report below. You can navigate through the pages in the report by either clicking on the pages listed below, or by using the keyword search tool below to find specific information within the annual report.-
 1
1 -
2
-
3
-
4
-
5
-
6
-
7
-
8
-
9
-
10
-
11
-
12
-
13
-
14
-
15
-
16
-
17
-
18
-
19
-
20
-
21
-
22
-
23
-
24
-
25
-
26
-
27
-
28
-
29
-
30
-
31
-
32
-
33
-
34
-
35
-
36
-
37
-
38
-
39
-
40
-
41
-
42
-
43
-
44
-
45
-
46
-
47
-
48
-
49
-
50
-
51
-
52
-
53
-
54
-
55
-
56
-
 57
57 -
 58
58 -
 59
59 -
 60
60 -
 61
61 -
 62
62 -
 63
63 -
 64
64 -
 65
65 -
 66
66 -
 67
67 -
 68
68 -
 69
69 -
 70
70 -
 71
71 -
 72
72 -
 73
73 -
 74
74 -
 75
75 -
 76
76 -
 77
77 -
78
-
79
-
80
-
81
-
82
 |
 |

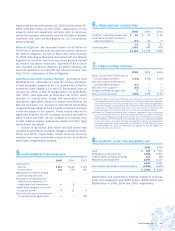
ComponentsofNetPeriodicBenefitCost Thecomponents
ofnetperiodicbenefitcostareasfollows:
PensionBenefits
2005 2004 2003
Servicecost $ 33 $ 32 $ 26
Interestcost 43 39 34
Amortizationofpriorservicecost(a) 3 3 4
Expectedreturnonplanassets (45) (40) (30)
Recognizedactuarialloss 22 19 6
Netperiodicbenefitcost $ 56 $ 53 $ 40
Additionallossrecognizeddueto:
Curtailment(b)$ 1 — —
Settlement(c)$ 3 — —
PostretirementMedicalBenefits
2005 2004 2003
Servicecost $ 2 $ 2 $ 2
Interestcost 5 5 5
Amortizationofpriorservicecost(a) — — —
Expectedreturnonplanassets — — —
Recognizedactuarialloss 1 1 1
Netperiodicbenefitcost $ 8 $ 8 $ 8
Additionallossrecognizeddueto:
Curtailment(b) N/A N/A N/A
Settlement(c) N/A N/A N/A
(a)Prior service costsare amortized on astraight-line basis over the average
remainingserviceperiodofemployeesexpectedtoreceivebenefits.
(b)Cur tailment losses have been recognized in facility actions as they have
resultedprimarilyfromrefranchisingactivities.
(c)Settlementlossresultsfrombenefitpaymentsfromanon-fundedplanexceeding
thesumoftheservicecostandinterestcostforthatplanduringtheyear.
Weighted-averageassumptionsusedtodeterminebenefit
obligationsatSeptember30:
Postretirement
PensionBenefits MedicalBenefits
2005 2004 2005 2004
Discountrate 5.75% 6.15% 5.75% 6.15%
Rateofcompensation
increase 3.75% 3.75% 3.75% 3.75%
Weighted-averageassumptionsusedtodeterminethenet
periodicbenefitcostforfiscalyears:
Postretirement
PensionBenefits MedicalBenefits
2005 2004 2003 2005 2004 2003
Discountrate 6.15% 6.25% 6.85% 6.15% 6.25% 6.85%
Long-termrate
ofreturnon
planassets 8.50% 8.50% 8.50% — — —
Rateof
compensation
increase 3.75% 3.75% 3.85% 3.75% 3.75% 3.85%
Ourestimatedlong-termrateofreturnonplanassetsrepre-
sentstheweighted-averageofexpectedfuturereturnson
theassetcategoriesincludedinourtargetinvestmentallo-
cation basedprimarily onthehistorical returns foreach
asset category, adjusted for an assessment of current
marketconditions.
AssumedhealthcarecosttrendratesatSeptember30:
Postretirement
MedicalBenefits
2005 2004
Healthcarecosttrendrateassumed
fornextyear 10% 11%
Ratetowhichthecosttrendrateis
assumedtodecline(theultimatetrendrate) 5.5% 5.5%
Yearthattheratereachestheultimate
trendrate 2012 2012
Thereisacaponourmedicalliabilityforcertainretirees.The
capforMedicareeligibleretireeswasreachedin2000and
thecapfornon-Medicareeligibleretireesisexpectedtobe
reachedin2009;oncethecapisreached,ourannualcost
perretireewillnotincrease.Aone-percentage-pointincrease
ordecreaseinassumedhealthcarecosttrendrateswould
have less than a $1million impact on total service and
interestcostandonthepostretirementbenefitobligation.
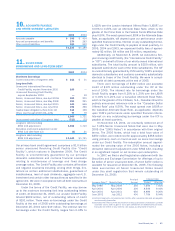
PlanAssets Ourpensionplanweighted-averageassetalloca-
tionsatSeptember30,byassetcategoryaresetforthbelow:
AssetCategory 2005 2004
Equitysecurities 71% 70%
Debtsecurities 29% 28%
Cash — 2%
Total 100% 100%
Ourprimaryobjectivesregardingthepensionassetsareto
optimizereturnonassetssubjectto acceptablerisk and
tomaintainliquidity,meetminimumfundingrequirements
andminimizeplanexpenses.Toachievetheseobjectives,
wehave adopteda passive investmentstrategy inwhich
theassetperformanceisdrivenprimarilybytheinvestment
allocation.Ourtargetinvestmentallocationis70%equity
securitiesand30%debtsecurities,consistingprimarilyof
lowcostindexmutualfundsthattrackseveralsub-catego-
riesofequityanddebtsecurityperformance.Theinvestment
strategyisprimarilydrivenbyourPlan’sparticipants’ages
andreflectsalong-terminvestmenthorizonfavoringahigher
equitycomponentintheinvestmentallocation.
AmutualfundheldasaninvestmentbythePlanincludes
YUMstockintheamountof$0.3millionand$0.2millionat
September30,2005and2004,respectively(lessthan1%
oftotalplanassetsineachinstance).
Yum!Brands,Inc. | 71.