Pizza Hut 2005 Annual Report Download - page 35
Download and view the complete annual report
Please find page 35 of the 2005 Pizza Hut annual report below. You can navigate through the pages in the report by either clicking on the pages listed below, or by using the keyword search tool below to find specific information within the annual report.-
 1
1 -
2
-
3
-
4
-
5
-
6
-
7
-
8
-
9
-
10
-
11
-
12
-
13
-
14
-
15
-
16
-
17
-
18
-
19
-
20
-
21
-
22
-
23
-
24
-
 25
25 -
 26
26 -
 27
27 -
 28
28 -
 29
29 -
 30
30 -
 31
31 -
 32
32 -
 33
33 -
 34
34 -
 35
35 -
 36
36 -
 37
37 -
 38
38 -
 39
39 -
 40
40 -
 41
41 -
 42
42 -
 43
43 -
 44
44 -
 45
45 -
46
-
47
-
48
-
49
-
50
-
51
-
52
-
53
-
54
-
55
-
56
-
57
-
58
-
59
-
60
-
61
-
62
-
63
-
64
-
65
-
66
-
67
-
68
-
69
-
70
-
71
-
72
-
73
-
74
-
75
-
76
-
77
-
78
-
79
-
80
-
81
-
82
 |
 |

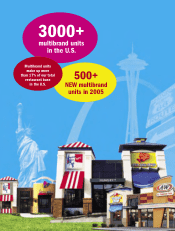
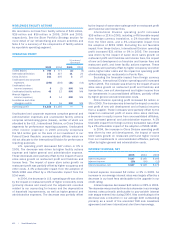
For2005and2004,Companymultibrandunitgrossadditions
were373and384,respectively.For2005and2004,franchise
multibrandunitgrossadditionswere171and169,respec-
tively.TherearenomultibrandunitsintheChinaDivision.
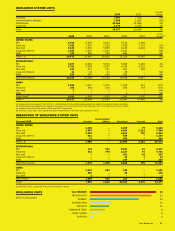
SYSTEMSALESGROWTH
Increase
excluding
Increase currency
excluding translation
currency and
Increase translation 53rdweek
2005 2004 2005 2004 2005
UnitedStates 5% 3% N/A N/A 4%
InternationalDivision 9% 14% 6% 6% 5%
ChinaDivision 13% 23% 11% 23% 11%
Worldwide 7% 8% 6% 5% 5%
Systemsalesgrowthincludestheresultsofallrestaurants
regardless ofownership,includingCompany-owned, fran-
chise,unconsolidatedaffiliateandlicenserestaurants.Sales
offranchise,unconsolidatedaffiliateandlicenserestaurants
generatefranchiseandlicensefeesfortheCompany(typically
atarateof4%to6%ofsales).Franchise,unconsolidated
affiliateandlicenserestaurantssalesarenotincludedin
CompanysalesontheConsolidatedStatementsofIncome;
however,thefranchiseandlicensefeesareincludedinthe
Company’srevenues. We believe system sales growth is
usefultoinvestorsasasignificantindicatoroftheoverall
strengthofourbusinessasitincorporatesallofourrevenue
drivers,Companyandfranchisesamestoresalesaswellas
netunitdevelopment.
TheincreaseinWorldwidesystemsalesin2005and
2004wasdrivenbynewunitdevelopmentandsamestore
salesgrowth,partiallyoffsetbystoreclosures.
TheincreaseinU.S.systemsaleswasdrivenbysame
storesalesgrowthandnewunitdevelopment,partiallyoffset
bystoreclosures.In2004,theincreaseinU.S.systemsales
wasdrivenbynewunitdevelopmentandsamestoresales
growth,partiallyoffsetbystoreclosures.
TheincreaseinInternationalDivisionsystemsalesin
2005and2004wasdrivenbynewunitdevelopmentand
samestoresalesgrowth,partiallyoffsetbystoreclosures.
In2005,theincreaseinChinaDivisionsystemsales
wasdrivenbynewunitdevelopment,partiallyoffsetbythe
impactofsamestoresalesdeclinesdrivenbythemainland
China supplier ingredient issue and consumer concerns
relatedtoAvianFlu.In2004,theincreaseinChinaDivision
systemsaleswasprimarilydrivenbynewunitdevelopment
andsamestoresalesgrowth.
REVENUES
%Increase
(Decrease)
%Increase excluding
(Decrease) currency
excluding translation
%Increase currency and53rd
Amount (Decrease) translation week
2005 2004 2005 2004 2005 2004 2005
Companysales
UnitedStates $5,294$5,163 3 2 N/A N/A 1
International
Division 1,676 1,747 (4) 17 (8) 11 (10)
ChinaDivision 1,255 1,082 16 24 14 23 14
Worldwide 8,225 7,992 3 7 2 6 1
Franchiseand
licensefees
UnitedStates 635 600 6 4 N/A N/A 5
International
Division 448 381 17 14 15 7 14
ChinaDivision 41 38 8 25 7 25 7
Worldwide 1,124 1,019 10 8 9 6 8
Totalrevenues
UnitedStates 5,929 5,763 3 2 N/A N/A 2
International
Division 2,124 2,128 — 17 (4) 10 (5)
ChinaDivision 1,296 1,120 16 24 14 24 14
Worldwide $9,349$9,011 4 8 3 6 2
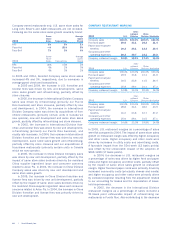
In 2005, the increase in Worldwide Company sales was
drivenbynewunitdevelopmentandsamestoresalesgrowth,
partiallyoffsetbyrefranchisingandstoreclosures.In2004,
theincreaseinWorldwideCompanysaleswasdrivenbynew
unitdevelopment,acquisitionsoffranchiseerestaurantsand
samestoresalesgrowth,partiallyoffsetbyrefranchising
andstoreclosures.
In2005,theincreaseinWorldwidefranchiseandlicense
feeswasdrivenbynewunitdevelopment,samestoresales
growthandrefranchising,partiallyoffsetbystoreclosures.
In2004,theincreaseinWorldwidefranchiseandlicense
feeswasdrivenbynewunitdevelopment,samestoresales
growth,andrefranchising,partiallyoffsetbystoreclosures
andacquisitionsoffranchiseerestaurants.
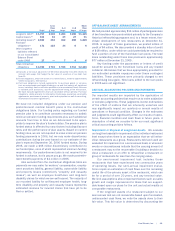
In2005,theincreaseinU.S.Companysaleswasdriven
by same store sales growth and new unit development,
partiallyoffsetbyrefranchisingandstoreclosures.In2004,
theincreaseinU.S.Companysaleswasdrivenbynewunit
developmentandsamestoresalesgrowth,partiallyoffsetby
refranchisingandstoreclosures.
U.S.samestoresalesincludesonlyCompanyrestau-
rantsthathavebeenopenoneyearormore.U.S.blended
same store sales includes KFC, PizzaHut and TacoBell
Yum!Brands,Inc. | 39.