Oracle 2010 Annual Report Download - page 81
Download and view the complete annual report
Please find page 81 of the 2010 Oracle annual report below. You can navigate through the pages in the report by either clicking on the pages listed below, or by using the keyword search tool below to find specific information within the annual report.-
 1
1 -
2
-
3
-
4
-
5
-
6
-
7
-
8
-
9
-
10
-
11
-
12
-
13
-
14
-
15
-
16
-
17
-
18
-
19
-
20
-
21
-
22
-
23
-
24
-
25
-
26
-
27
-
28
-
29
-
30
-
31
-
32
-
33
-
34
-
35
-
36
-
37
-
38
-
39
-
40
-
41
-
42
-
43
-
44
-
45
-
46
-
47
-
48
-
49
-
50
-
51
-
52
-
53
-
54
-
55
-
56
-
57
-
58
-
59
-
60
-
61
-
62
-
63
-
64
-
65
-
66
-
67
-
68
-
69
-
70
-
 71
71 -
 72
72 -
 73
73 -
 74
74 -
 75
75 -
 76
76 -
 77
77 -
 78
78 -
 79
79 -
 80
80 -
 81
81 -
 82
82 -
 83
83 -
 84
84 -
 85
85 -
 86
86 -
 87
87 -
 88
88 -
 89
89 -
 90
90 -
 91
91 -
92
-
93
-
94
-
95
-
96
-
97
-
98
-
99
-
100
-
101
-
102
-
103
-
104
-
105
-
106
-
107
-
108
-
109
-
110
-
111
-
112
-
113
-
114
-
115
-
116
-
117
-
118
-
119
-
120
-
121
-
122
-
123
-
124
-
125
-
126
-
127
-
128
-
129
-
130
-
131
-
132
-
133
-
134
-
135
-
136
-
137
-
138
-
139
-
140
-
141
-
142
-
143
-
144
-
145
-
146
-
147
-
148
-
149
-
150
-
151
-
152
-
153
-
154
-
155
-
156
-
157
-
158
-
159
-
160
-
161
-
162
-
163
-
164
-
165
-
166
-
167
-
168
-
169
-
170
-
171
-
172
-
173
-
174
-
175
-
176
-
177
-
178
-
179
-
180
-
181
-
182
-
183
-
184
-
185
-
186
-
187
-
188
-
189
-
190
-
191
-
192
-
193
-
194
-
195
-
196
-
197
-
198
-
199
-
200
-
201
-
202
-
203
-
204
-
205
-
206
-
207
-
208
-
209
-
210
-
211
-
212
-
213
-
214
-
215
-
216
-
217
-
218
-
219
-
220
-
221
-
222
-
223
-
224
-
225
-
226
-
227
-
228
-
229
-
230
-
231
-
232
-
233
-
234
-
235
-
236
-
237
-
238
-
239
-
240
-
241
-
242
-
243
-
244
-
245
-
246
-
247
-
248
-
249
-
250
-
251
-
252
-
253
-
254
-
255
-
256
-
257
-
258
-
259
-
260
-
261
-
262
-
263
-
264
-
265
-
266
-
267
-
268
-
269
-
270
-
271
-
272
 |
 |

Table of Contents
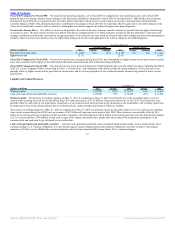
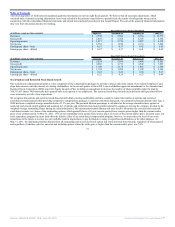
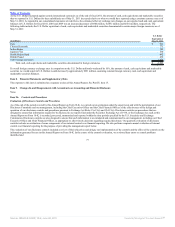
As the U.S. Dollar fluctuated against certain international currencies as of the end of fiscal 2011, the amount of cash, cash equivalents and marketable securities
that we reported in U.S. Dollars for these subsidiaries as of May 31, 2011 increased relative to what we would have reported using a constant currency rate as of
May 31, 2010. As reported in our consolidated statements of cash flows, the estimated effect of exchange rate changes on our reported cash and cash equivalents
balances in U.S. Dollars for fiscal 2011, 2010 and 2009 was an increase (decrease) of $600 million, $(107) million and $(501) million, respectively. The
following table includes the U.S. Dollar equivalent of cash, cash equivalents and marketable securities denominated in certain major foreign currencies as of
May 31, 2011:
(in millions)
U.S. Dollar
Equivalent at
May 31, 2011
Euro $ 993
Chinese Renminbi 775
Indian Rupee 749
Japanese Yen 530
South African Rand 492
British Pound 436
Other foreign currencies 2,934
Total cash, cash equivalents and marketable securities denominated in foreign currencies $ 6,909
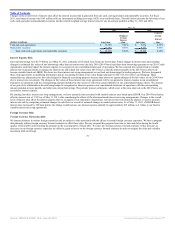
If overall foreign currency exchange rates in comparison to the U.S. Dollar uniformly weakened by 10%, the amount of cash, cash equivalents and marketable
securities we would report in U.S. Dollars would decrease by approximately $691 million, assuming constant foreign currency cash, cash equivalent and
marketable securities balances.
Item 8. Financial Statements and Supplementary Data
The response to this item is submitted as a separate section of this Annual Report. See Part IV, Item 15.
Item 9. Changes In and Disagreements with Accountants on Accounting and Financial Disclosure
None.
Item 9A. Controls and Procedures
Evaluation of Disclosure Controls and Procedures
As of the end of the period covered by this Annual Report on Form 10-K, we carried out an evaluation under the supervision and with the participation of our
Disclosure Committee and our management, including the Chief Executive Officer and the Chief Financial Officer, of the effectiveness of the design and
operation of our disclosure controls and procedures pursuant to Exchange Act Rules 13a-15(e) and 15d-15(e). Disclosure controls are procedures that are
designed to ensure that information required to be disclosed in our reports filed under the Securities Exchange Act of 1934, or the Exchange Act, such as this
Annual Report on Form 10-K, is recorded, processed, summarized and reported within the time periods specified by the U.S. Securities and Exchange
Commission. Disclosure controls are also designed to ensure that such information is accumulated and communicated to our management, including our Chief
Executive Officer and Chief Financial Officer, as appropriate to allow timely decisions regarding required disclosure. Our quarterly evaluation of disclosure
controls includes an evaluation of some components of our internal control over financial reporting. We also perform a separate annual evaluation of internal
control over financial reporting for the purpose of providing the management report below.
The evaluation of our disclosure controls included a review of their objectives and design, our implementation of the controls and the effect of the controls on the
information generated for use in this Annual Report on Form 10-K. In the course of the controls evaluation, we reviewed data errors or control problems
identified and
77
Source: ORACLE CORP, 10-K, June 28, 2011 Powered by Morningstar® Document Research℠