Oracle 2010 Annual Report Download - page 67
Download and view the complete annual report
Please find page 67 of the 2010 Oracle annual report below. You can navigate through the pages in the report by either clicking on the pages listed below, or by using the keyword search tool below to find specific information within the annual report.-
 1
1 -
2
-
3
-
4
-
5
-
6
-
7
-
8
-
9
-
10
-
11
-
12
-
13
-
14
-
15
-
16
-
17
-
18
-
19
-
20
-
21
-
22
-
23
-
24
-
25
-
26
-
27
-
28
-
29
-
30
-
31
-
32
-
33
-
34
-
35
-
36
-
37
-
38
-
39
-
40
-
41
-
42
-
43
-
44
-
45
-
46
-
47
-
48
-
49
-
50
-
51
-
52
-
53
-
54
-
55
-
56
-
 57
57 -
 58
58 -
 59
59 -
 60
60 -
 61
61 -
 62
62 -
 63
63 -
 64
64 -
 65
65 -
 66
66 -
 67
67 -
 68
68 -
 69
69 -
 70
70 -
 71
71 -
 72
72 -
 73
73 -
 74
74 -
 75
75 -
 76
76 -
 77
77 -
78
-
79
-
80
-
81
-
82
-
83
-
84
-
85
-
86
-
87
-
88
-
89
-
90
-
91
-
92
-
93
-
94
-
95
-
96
-
97
-
98
-
99
-
100
-
101
-
102
-
103
-
104
-
105
-
106
-
107
-
108
-
109
-
110
-
111
-
112
-
113
-
114
-
115
-
116
-
117
-
118
-
119
-
120
-
121
-
122
-
123
-
124
-
125
-
126
-
127
-
128
-
129
-
130
-
131
-
132
-
133
-
134
-
135
-
136
-
137
-
138
-
139
-
140
-
141
-
142
-
143
-
144
-
145
-
146
-
147
-
148
-
149
-
150
-
151
-
152
-
153
-
154
-
155
-
156
-
157
-
158
-
159
-
160
-
161
-
162
-
163
-
164
-
165
-
166
-
167
-
168
-
169
-
170
-
171
-
172
-
173
-
174
-
175
-
176
-
177
-
178
-
179
-
180
-
181
-
182
-
183
-
184
-
185
-
186
-
187
-
188
-
189
-
190
-
191
-
192
-
193
-
194
-
195
-
196
-
197
-
198
-
199
-
200
-
201
-
202
-
203
-
204
-
205
-
206
-
207
-
208
-
209
-
210
-
211
-
212
-
213
-
214
-
215
-
216
-
217
-
218
-
219
-
220
-
221
-
222
-
223
-
224
-
225
-
226
-
227
-
228
-
229
-
230
-
231
-
232
-
233
-
234
-
235
-
236
-
237
-
238
-
239
-
240
-
241
-
242
-
243
-
244
-
245
-
246
-
247
-
248
-
249
-
250
-
251
-
252
-
253
-
254
-
255
-
256
-
257
-
258
-
259
-
260
-
261
-
262
-
263
-
264
-
265
-
266
-
267
-
268
-
269
-
270
-
271
-
272
 |
 |

Table of Contents
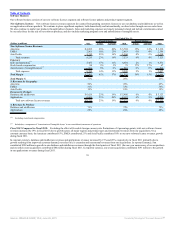
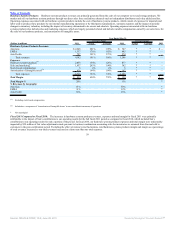
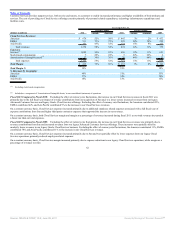
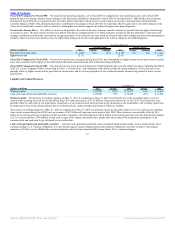
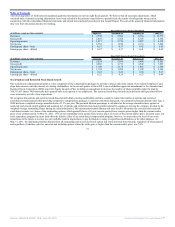
Education: Education revenues are earned by providing instructor-led, media-based and internet-based training in the use of our software and hardware
products. Education expenses primarily consist of personnel related expenditures, facilities and external contractor costs.
Year Ended May 31,
Percent Change Percent Change
(Dollars in millions) 2011 Actual Constant 2010 Actual Constant 2009
Education Revenues:
Americas $ 148 11% 10% $ 132 -12% -13% $ 151
EMEA 122 13% 14% 108 -15% -14% 127
Asia Pacific 85 20% 12% 71 0% -6% 71
Total revenues 355 14% 12% 311 -11% -12% 349
Expenses:
Services(1) 281 9% 8% 257 -12% -13% 292
Stock-based compensation 2 13% 13% 2 1% 1% 2
Total expenses 283 9% 8% 259 -12% -13% 294
Total Margin $ 72 37% 33% $ 52 -4% -7% $ 55
Total Margin % 20% 17% 16%
% Revenues by Geography:
Americas 42% 42% 43%
EMEA 34% 35% 37%
Asia Pacific 24% 23% 20%
(1) Excluding stock-based compensation
Fiscal 2011 Compared to Fiscal 2010: On a constant currency basis, the increases in education revenues, expenses and total margin in fiscal 2011 were
primarily attributable to the full fiscal year impact of Sun’s contributions to our operating results. Excluding the effect of currency rate fluctuations, the Americas
contributed 38%, EMEA contributed 38% and Asia Pacific contributed 24% to the increase in our education revenues during fiscal 2011. On a constant currency
basis, education margin and margin as a percentage of revenues increased during fiscal 2011 as a result of our total revenues increasing at a faster rate than our
total expenses.
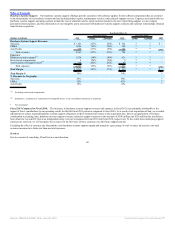
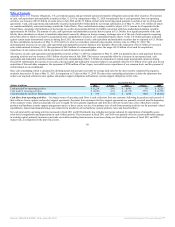
Fiscal 2010 Compared to Fiscal 2009: On a constant currency basis, education revenues decreased in fiscal 2010 as we experienced weaker demand for our
educational services that we believe was the result of reduced IT spending on services by our customers due to weaker global economic conditions, partially
offset by additional revenues from our acquisition of Sun. On a constant currency basis, education expenses decreased in fiscal 2010 as we reduced our legacy
Oracle-based employee related and external contractor expenses. These expense decreases were partially offset by additional expenses, primarily employee
related, from our acquisition of Sun. On a constant currency basis, education margin decreased due to our revenue decrease, while margin as a percentage of
revenues increased due to expense reductions.
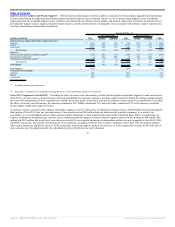
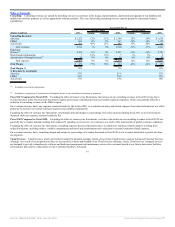
Research and Development Expenses: Research and development expenses consist primarily of personnel related expenditures. We intend to continue to
invest significantly in our research and development efforts because, in our judgment, they are essential to maintaining our competitive position.
Year Ended May 31,
Percent Change Percent Change
(Dollars in millions) 2011 Actual Constant 2010 Actual Constant 2009
Research and development(1) $ 4,288 39% 38% $ 3,082 18% 17% $ 2,612
Stock-based compensation 231 35% 35% 172 11% 11% 155
Total expenses $ 4,519 39% 38% $ 3,254 18% 17% $ 2,767
% of Total Revenues 13% 12% 12%
(1) Excluding stock-based compensation
63
Source: ORACLE CORP, 10-K, June 28, 2011 Powered by Morningstar® Document Research℠