Oracle 2010 Annual Report Download - page 239
Download and view the complete annual report
Please find page 239 of the 2010 Oracle annual report below. You can navigate through the pages in the report by either clicking on the pages listed below, or by using the keyword search tool below to find specific information within the annual report.-
 1
1 -
2
-
3
-
4
-
5
-
6
-
7
-
8
-
9
-
10
-
11
-
12
-
13
-
14
-
15
-
16
-
17
-
18
-
19
-
20
-
21
-
22
-
23
-
24
-
25
-
26
-
27
-
28
-
29
-
30
-
31
-
32
-
33
-
34
-
35
-
36
-
37
-
38
-
39
-
40
-
41
-
42
-
43
-
44
-
45
-
46
-
47
-
48
-
49
-
50
-
51
-
52
-
53
-
54
-
55
-
56
-
57
-
58
-
59
-
60
-
61
-
62
-
63
-
64
-
65
-
66
-
67
-
68
-
69
-
70
-
71
-
72
-
73
-
74
-
75
-
76
-
77
-
78
-
79
-
80
-
81
-
82
-
83
-
84
-
85
-
86
-
87
-
88
-
89
-
90
-
91
-
92
-
93
-
94
-
95
-
96
-
97
-
98
-
99
-
100
-
101
-
102
-
103
-
104
-
105
-
106
-
107
-
108
-
109
-
110
-
111
-
112
-
113
-
114
-
115
-
116
-
117
-
118
-
119
-
120
-
121
-
122
-
123
-
124
-
125
-
126
-
127
-
128
-
129
-
130
-
131
-
132
-
133
-
134
-
135
-
136
-
137
-
138
-
139
-
140
-
141
-
142
-
143
-
144
-
145
-
146
-
147
-
148
-
149
-
150
-
151
-
152
-
153
-
154
-
155
-
156
-
157
-
158
-
159
-
160
-
161
-
162
-
163
-
164
-
165
-
166
-
167
-
168
-
169
-
170
-
171
-
172
-
173
-
174
-
175
-
176
-
177
-
178
-
179
-
180
-
181
-
182
-
183
-
184
-
185
-
186
-
187
-
188
-
189
-
190
-
191
-
192
-
193
-
194
-
195
-
196
-
197
-
198
-
199
-
200
-
201
-
202
-
203
-
204
-
205
-
206
-
207
-
208
-
209
-
210
-
211
-
212
-
213
-
214
-
215
-
216
-
217
-
218
-
219
-
220
-
221
-
222
-
223
-
224
-
225
-
226
-
227
-
228
-
 229
229 -
 230
230 -
 231
231 -
 232
232 -
 233
233 -
 234
234 -
 235
235 -
 236
236 -
 237
237 -
 238
238 -
 239
239 -
 240
240 -
 241
241 -
 242
242 -
 243
243 -
 244
244 -
 245
245 -
 246
246 -
 247
247 -
 248
248 -
 249
249 -
250
-
251
-
252
-
253
-
254
-
255
-
256
-
257
-
258
-
259
-
260
-
261
-
262
-
263
-
264
-
265
-
266
-
267
-
268
-
269
-
270
-
271
-
272
 |
 |

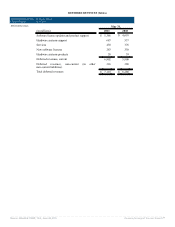
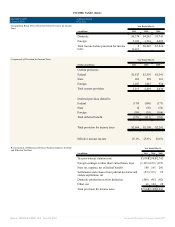
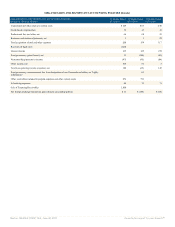
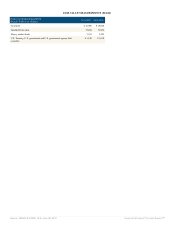
Stock-based compensation (500) (421) (340)
Interest expense (808) (754) (630)
Non-operating income (expense), net 120 (139) 108
Income before provision for income taxes $11,411 $8,243 $7,834
__________
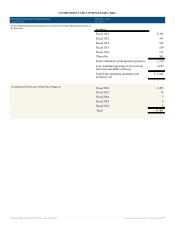
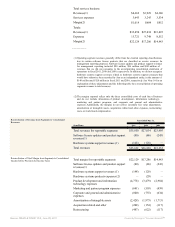
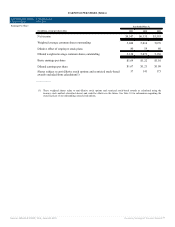
(1) Software license updates and product support revenues for management reporting
include $80 million, $86 million and $243 million of revenues that we did not recognize
in the accompanying consolidated statements of operations for fiscal 2011, 2010 and
2009, respectively. In addition, we did not recognize hardware systems support revenues
related to hardware systems support contracts that would have otherwise been recorded
by Sun as an independent entity, in the amounts of $148 million and $128 million for
fiscal 2011 and 2010, respectively. See Note 10 for an explanation of these adjustments
and this table for a reconciliation of operating segment revenues to total revenues.
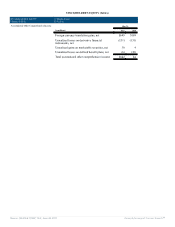
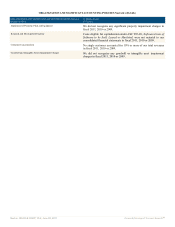
(2) Represents the effects of fair value adjustments to our inventories acquired from Sun that
were sold to customers in the periods presented. Business combination accounting rules
require us to account for inventories assumed from our acquisitions at their fair values.
The amount included in hardware systems products expenses above is intended to adjust
these expenses to the hardware systems products expenses that would have been
otherwise recorded by Sun as an independent entity upon the sale of these inventories. If
we assume inventories in future acquisitions, we will be required to assess their fair
values, which may result in fair value adjustments to those inventories.
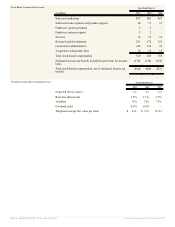
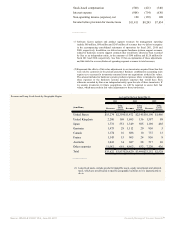
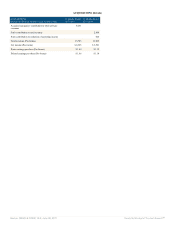
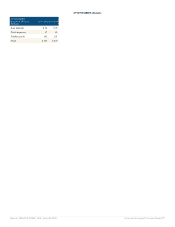
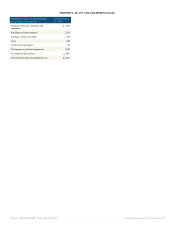
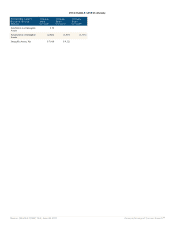
Revenue and Long Lived Assets by Geographic Region As of and for the Year Ended May 31,
2011 2010 2009
(in millions)
Revenues
Long
Lived
Assets(1)
Revenues
Long
Lived
Assets(1)
Revenues
Long
Lived
Assets(1)
United States $15,274 $2,359$11,472 $2,141$10,190 $1,466
United Kingdom 2,200 168 1,685 136 1,587 89
Japan 1,731 551 1,349 505 1,189 485
Germany 1,475 29 1,112 20 956 5
Canada 1,174 16 888 10 737 13
France 1,145 15 965 24 856 8
Australia 1,041 34 687 28 517 26
Other countries 11,582 661 8,662 632 7,220 436
Total $35,622 $3,833$26,820 $3,496$23,252 $2,528
__________
(1) Long-lived assets exclude goodwill, intangible assets, equity investments and deferred
taxes, which are not allocated to specific geographic locations as it is impracticable to
do so.
Source: ORACLE CORP, 10-K, June 28, 2011 Powered by Morningstar® Document Research℠