Oracle 2010 Annual Report Download - page 75
Download and view the complete annual report
Please find page 75 of the 2010 Oracle annual report below. You can navigate through the pages in the report by either clicking on the pages listed below, or by using the keyword search tool below to find specific information within the annual report.-
 1
1 -
2
-
3
-
4
-
5
-
6
-
7
-
8
-
9
-
10
-
11
-
12
-
13
-
14
-
15
-
16
-
17
-
18
-
19
-
20
-
21
-
22
-
23
-
24
-
25
-
26
-
27
-
28
-
29
-
30
-
31
-
32
-
33
-
34
-
35
-
36
-
37
-
38
-
39
-
40
-
41
-
42
-
43
-
44
-
45
-
46
-
47
-
48
-
49
-
50
-
51
-
52
-
53
-
54
-
55
-
56
-
57
-
58
-
59
-
60
-
61
-
62
-
63
-
64
-
 65
65 -
 66
66 -
 67
67 -
 68
68 -
 69
69 -
 70
70 -
 71
71 -
 72
72 -
 73
73 -
 74
74 -
 75
75 -
 76
76 -
 77
77 -
 78
78 -
 79
79 -
 80
80 -
 81
81 -
 82
82 -
 83
83 -
 84
84 -
 85
85 -
86
-
87
-
88
-
89
-
90
-
91
-
92
-
93
-
94
-
95
-
96
-
97
-
98
-
99
-
100
-
101
-
102
-
103
-
104
-
105
-
106
-
107
-
108
-
109
-
110
-
111
-
112
-
113
-
114
-
115
-
116
-
117
-
118
-
119
-
120
-
121
-
122
-
123
-
124
-
125
-
126
-
127
-
128
-
129
-
130
-
131
-
132
-
133
-
134
-
135
-
136
-
137
-
138
-
139
-
140
-
141
-
142
-
143
-
144
-
145
-
146
-
147
-
148
-
149
-
150
-
151
-
152
-
153
-
154
-
155
-
156
-
157
-
158
-
159
-
160
-
161
-
162
-
163
-
164
-
165
-
166
-
167
-
168
-
169
-
170
-
171
-
172
-
173
-
174
-
175
-
176
-
177
-
178
-
179
-
180
-
181
-
182
-
183
-
184
-
185
-
186
-
187
-
188
-
189
-
190
-
191
-
192
-
193
-
194
-
195
-
196
-
197
-
198
-
199
-
200
-
201
-
202
-
203
-
204
-
205
-
206
-
207
-
208
-
209
-
210
-
211
-
212
-
213
-
214
-
215
-
216
-
217
-
218
-
219
-
220
-
221
-
222
-
223
-
224
-
225
-
226
-
227
-
228
-
229
-
230
-
231
-
232
-
233
-
234
-
235
-
236
-
237
-
238
-
239
-
240
-
241
-
242
-
243
-
244
-
245
-
246
-
247
-
248
-
249
-
250
-
251
-
252
-
253
-
254
-
255
-
256
-
257
-
258
-
259
-
260
-
261
-
262
-
263
-
264
-
265
-
266
-
267
-
268
-
269
-
270
-
271
-
272
 |
 |

Table of Contents
as our working capital needs, our cash requirements for acquisitions and dividend repayments, our debt repayment obligations (described further below), our
stock price, and economic and market conditions. Our stock repurchases may be effected from time to time through open market purchases or pursuant to a Rule
10b5-1 plan. Our stock repurchase program may be accelerated, suspended, delayed or discontinued at any time.
Cash Dividends: In fiscal 2011, we declared and paid cash dividends of $0.21 per share that totaled $1.1 billion. In June 2011, our Board of Directors declared
a quarterly cash dividend of $0.06 per share of outstanding common stock payable on August 3, 2011 to stockholders of record as of the close of business on
July 13, 2011. Future declarations of dividends and the establishment of future record and payment dates are subject to the final determination of our Board of
Directors.
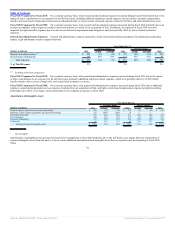
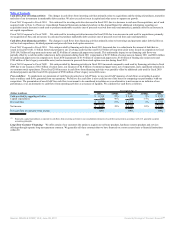
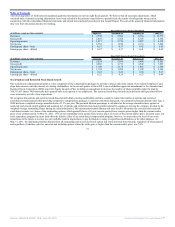
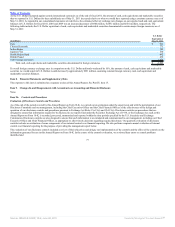
Contractual Obligations: The contractual obligations presented in the table below represent our estimates of future payments under fixed contractual
obligations and commitments. Changes in our business needs, cancellation provisions, changing interest rates and other factors may result in actual payments
differing from these estimates. We cannot provide certainty regarding the timing and amounts of payments. We have presented below a summary of the most
significant assumptions used in preparing this information within the context of our consolidated financial position, results of operations and cash flows. The
following is a summary of our contractual obligations as of May 31, 2011:
Year Ending May 31,
(Dollars in millions) Total 2012 2013 2014 2015 2016 Thereafter
Principal payments on short-term and long-term borrowings(1) $ 15,900 $ 1,150 $ 1,250 $ — $ 1,500 $ 2,000 $ 10,000
Interest payments on borrowings(1) 10,799 738 738 676 665 655 7,327
Operating leases(2) 1,570 458 341 226 159 121 265
Purchase obligations and other(3) 481 453 15 7 3 3 —
Total contractual obligations $ 28,750 $ 2,799 $ 2,344 $ 909 $ 2,327 $ 2,779 $ 17,592
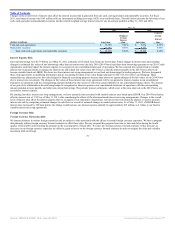
(1) Our total borrowings consist of the following as of May 31, 2011 (dollars in millions):
Amount
Short-term borrowings (effective interest rate of 0.44%) $ 1,150
4.95% senior notes due April 2013 1,250
3.75% senior notes due July 2014, including fair value adjustment of $69 1,569
5.25% senior notes due January 2016, net of discount of $5 1,995
5.75% senior notes due April 2018, net of discount of $1 2,499
5.00% senior notes due July 2019, net of discount of $5 1,745
3.875% senior notes due July 2020, net of discount of $2 998
6.50% senior notes due April 2038, net of discount of $2 1,248
6.125% senior notes due July 2039, net of discount of $8 1,242
5.375% senior notes due July 2040, net of discount of $25 2,225
Total borrowings $ 15,921
We have entered into certain interest rate swap agreements related to our July 2014 senior notes that have the economic effect of modifying the fixed interest obligations associated with
these senior notes so that the interest obligations effectively became variable pursuant to a LIBOR-based index. Interest payments on the July 2014 senior notes presented in the contractual
obligations table above have been estimated using an interest rate of 1.38%, which represented our effective interest rate as of May 31, 2011 after consideration of these fixed to variable
interest rate swap agreements, and are subject to change in future periods. The changes in fair value of our debt associated with the interest rate risk that we are hedging pursuant to these
agreements are included in notes payable and other non-current borrowings in our consolidated balance sheet and have been included in the above table of borrowings.
(2) Primarily represents leases of facilities and includes future minimum rent payments for facilities that we have vacated pursuant to our restructuring and merger integration activities. We
have approximately $320 million in facility obligations, net of estimated sublease income, in accrued restructuring for these locations in our consolidated balance sheet at May 31, 2011.
(3) Primarily represents amounts associated with agreements that are enforceable, legally binding and specify terms, including: fixed or minimum quantities to be purchased; fixed, minimum
or variable price provisions; and the approximate timing of the payment. We
71
Source: ORACLE CORP, 10-K, June 28, 2011 Powered by Morningstar® Document Research℠