Oracle 2010 Annual Report Download - page 39
Download and view the complete annual report
Please find page 39 of the 2010 Oracle annual report below. You can navigate through the pages in the report by either clicking on the pages listed below, or by using the keyword search tool below to find specific information within the annual report.-
 1
1 -
2
-
3
-
4
-
5
-
6
-
7
-
8
-
9
-
10
-
11
-
12
-
13
-
14
-
15
-
16
-
17
-
18
-
19
-
20
-
21
-
22
-
23
-
24
-
25
-
26
-
27
-
28
-
 29
29 -
 30
30 -
 31
31 -
 32
32 -
 33
33 -
 34
34 -
 35
35 -
 36
36 -
 37
37 -
 38
38 -
 39
39 -
 40
40 -
 41
41 -
 42
42 -
 43
43 -
 44
44 -
 45
45 -
 46
46 -
 47
47 -
 48
48 -
 49
49 -
50
-
51
-
52
-
53
-
54
-
55
-
56
-
57
-
58
-
59
-
60
-
61
-
62
-
63
-
64
-
65
-
66
-
67
-
68
-
69
-
70
-
71
-
72
-
73
-
74
-
75
-
76
-
77
-
78
-
79
-
80
-
81
-
82
-
83
-
84
-
85
-
86
-
87
-
88
-
89
-
90
-
91
-
92
-
93
-
94
-
95
-
96
-
97
-
98
-
99
-
100
-
101
-
102
-
103
-
104
-
105
-
106
-
107
-
108
-
109
-
110
-
111
-
112
-
113
-
114
-
115
-
116
-
117
-
118
-
119
-
120
-
121
-
122
-
123
-
124
-
125
-
126
-
127
-
128
-
129
-
130
-
131
-
132
-
133
-
134
-
135
-
136
-
137
-
138
-
139
-
140
-
141
-
142
-
143
-
144
-
145
-
146
-
147
-
148
-
149
-
150
-
151
-
152
-
153
-
154
-
155
-
156
-
157
-
158
-
159
-
160
-
161
-
162
-
163
-
164
-
165
-
166
-
167
-
168
-
169
-
170
-
171
-
172
-
173
-
174
-
175
-
176
-
177
-
178
-
179
-
180
-
181
-
182
-
183
-
184
-
185
-
186
-
187
-
188
-
189
-
190
-
191
-
192
-
193
-
194
-
195
-
196
-
197
-
198
-
199
-
200
-
201
-
202
-
203
-
204
-
205
-
206
-
207
-
208
-
209
-
210
-
211
-
212
-
213
-
214
-
215
-
216
-
217
-
218
-
219
-
220
-
221
-
222
-
223
-
224
-
225
-
226
-
227
-
228
-
229
-
230
-
231
-
232
-
233
-
234
-
235
-
236
-
237
-
238
-
239
-
240
-
241
-
242
-
243
-
244
-
245
-
246
-
247
-
248
-
249
-
250
-
251
-
252
-
253
-
254
-
255
-
256
-
257
-
258
-
259
-
260
-
261
-
262
-
263
-
264
-
265
-
266
-
267
-
268
-
269
-
270
-
271
-
272
 |
 |

Table of Contents
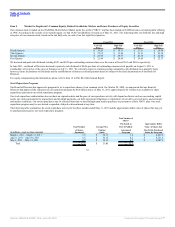
Item 6. Selected Financial Data
The following table sets forth selected financial data as of and for the last five fiscal years. This selected financial data should be read in conjunction with the
consolidated financial statements and related notes included in Item 15 of this Annual Report. Over the last five fiscal years, we have acquired a number of
companies including Sun Microsystems, Inc. in fiscal 2010, BEA Systems, Inc. in fiscal 2008 and Hyperion Solutions Corporation in fiscal 2007, among others.
The results of our acquired companies have been included in our consolidated financial statements since their respective dates of acquisition and have contributed
to our growth in revenues, income and earnings per share.
As of and for the Year Ended May 31,
(in millions, except per share amounts) 2011 2010 2009 2008 2007
Consolidated Statements of Operations Data:
Total revenues $ 35,622 $ 26,820 $ 23,252 $ 22,430 $ 17,996
Operating income $ 12,033 $ 9,062 $ 8,321 $ 7,844 $ 5,974
Net income $ 8,547 $ 6,135 $ 5,593 $ 5,521 $ 4,274
Earnings per share—basic $ 1.69 $ 1.22 $ 1.10 $ 1.08 $ 0.83
Earnings per share—diluted $ 1.67 $ 1.21 $ 1.09 $ 1.06 $ 0.81
Basic weighted average common shares outstanding 5,048 5,014 5,070 5,133 5,170
Diluted weighted average common shares outstanding 5,128 5,073 5,130 5,229 5,269
Cash dividends declared per common share $ 0.21 $ 0.20 $ 0.05 $ — $ —
Consolidated Balance Sheets Data:
Working capital $ 24,982 $ 12,313 $ 9,432 $ 8,074 $ 3,496
Total assets $ 73,535 $ 61,578 $ 47,416 $ 47,268 $ 34,572
Notes payable and other borrowings(1) $ 15,922 $ 14,655 $ 10,238 $ 11,236 $ 7,593
(1) Our notes payable and other borrowings, which represented the summation of our notes payable, current and other current borrowings and notes payable and other non-current borrowings
as reported per our consolidated balance sheets as of the dates listed in the table above, generally increased between fiscal 2007 and 2011 due to the issuances of $1.15 billion of short-term
borrowings made pursuant to our revolving credit agreements and $3.25 billion of long-term senior notes in fiscal 2011, $4.5 billion of long-term senior notes in fiscal 2010 and $5.0
billion of long-term senior notes in fiscal 2008. See Note 8 of Notes to Consolidated Financial Statements for additional information regarding our notes payable and other borrowings.
35
Source: ORACLE CORP, 10-K, June 28, 2011 Powered by Morningstar® Document Research℠