Oracle 2010 Annual Report Download - page 134
Download and view the complete annual report
Please find page 134 of the 2010 Oracle annual report below. You can navigate through the pages in the report by either clicking on the pages listed below, or by using the keyword search tool below to find specific information within the annual report.-
 1
1 -
2
-
3
-
4
-
5
-
6
-
7
-
8
-
9
-
10
-
11
-
12
-
13
-
14
-
15
-
16
-
17
-
18
-
19
-
20
-
21
-
22
-
23
-
24
-
25
-
26
-
27
-
28
-
29
-
30
-
31
-
32
-
33
-
34
-
35
-
36
-
37
-
38
-
39
-
40
-
41
-
42
-
43
-
44
-
45
-
46
-
47
-
48
-
49
-
50
-
51
-
52
-
53
-
54
-
55
-
56
-
57
-
58
-
59
-
60
-
61
-
62
-
63
-
64
-
65
-
66
-
67
-
68
-
69
-
70
-
71
-
72
-
73
-
74
-
75
-
76
-
77
-
78
-
79
-
80
-
81
-
82
-
83
-
84
-
85
-
86
-
87
-
88
-
89
-
90
-
91
-
92
-
93
-
94
-
95
-
96
-
97
-
98
-
99
-
100
-
101
-
102
-
103
-
104
-
105
-
106
-
107
-
108
-
109
-
110
-
111
-
112
-
113
-
114
-
115
-
116
-
117
-
118
-
119
-
120
-
121
-
122
-
123
-
 124
124 -
 125
125 -
 126
126 -
 127
127 -
 128
128 -
 129
129 -
 130
130 -
 131
131 -
 132
132 -
 133
133 -
 134
134 -
 135
135 -
 136
136 -
 137
137 -
 138
138 -
 139
139 -
 140
140 -
 141
141 -
 142
142 -
 143
143 -
 144
144 -
145
-
146
-
147
-
148
-
149
-
150
-
151
-
152
-
153
-
154
-
155
-
156
-
157
-
158
-
159
-
160
-
161
-
162
-
163
-
164
-
165
-
166
-
167
-
168
-
169
-
170
-
171
-
172
-
173
-
174
-
175
-
176
-
177
-
178
-
179
-
180
-
181
-
182
-
183
-
184
-
185
-
186
-
187
-
188
-
189
-
190
-
191
-
192
-
193
-
194
-
195
-
196
-
197
-
198
-
199
-
200
-
201
-
202
-
203
-
204
-
205
-
206
-
207
-
208
-
209
-
210
-
211
-
212
-
213
-
214
-
215
-
216
-
217
-
218
-
219
-
220
-
221
-
222
-
223
-
224
-
225
-
226
-
227
-
228
-
229
-
230
-
231
-
232
-
233
-
234
-
235
-
236
-
237
-
238
-
239
-
240
-
241
-
242
-
243
-
244
-
245
-
246
-
247
-
248
-
249
-
250
-
251
-
252
-
253
-
254
-
255
-
256
-
257
-
258
-
259
-
260
-
261
-
262
-
263
-
264
-
265
-
266
-
267
-
268
-
269
-
270
-
271
-
272
 |
 |

Table of Contents
ORACLE CORPORATION
NOTES TO CONSOLIDATED FINANCIAL STATEMENTS—(Continued)
May 31, 2011
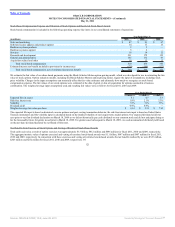
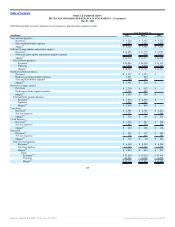
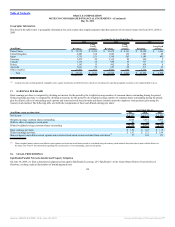
Geographic Information
Disclosed in the table below is geographic information for each country that comprised greater than three percent of our total revenues for fiscal 2011, 2010 or
2009.
As of and for the Year Ended May 31,
2011 2010 2009
(in millions) Revenues
Long
Lived
Assets(1) Revenues
Long
Lived
Assets(1) Revenues
Long Lived
Assets(1)
United States $ 15,274 $ 2,359 $ 11,472 $ 2,141 $ 10,190 $ 1,466
United Kingdom 2,200 168 1,685 136 1,587 89
Japan 1,731 551 1,349 505 1,189 485
Germany 1,475 29 1,112 20 956 5
Canada 1,174 16 888 10 737 13
France 1,145 15 965 24 856 8
Australia 1,041 34 687 28 517 26
Other countries 11,582 661 8,662 632 7,220 436
Total $ 35,622 $ 3,833 $ 26,820 $ 3,496 $ 23,252 $ 2,528
(1) Long-lived assets exclude goodwill, intangible assets, equity investments and deferred taxes, which are not allocated to specific geographic locations as it is impracticable to do so.
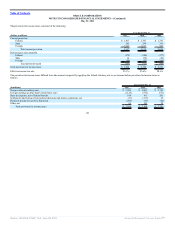
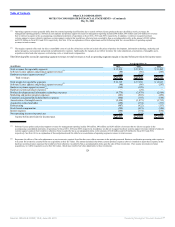
17. EARNINGS PER SHARE
Basic earnings per share is computed by dividing net income for the period by the weighted average number of common shares outstanding during the period.
Diluted earnings per share is computed by dividing net income for the period by the weighted average number of common shares outstanding during the period,
plus the dilutive effect of outstanding stock options and restricted stock-based awards and shares issuable under the employee stock purchase plan using the
treasury stock method. The following table sets forth the computation of basic and diluted earnings per share:
Year Ended May 31,
(in millions, except per share data) 2011 2010 2009
Net income $ 8,547 $ 6,135 $ 5,593
Weighted average common shares outstanding 5,048 5,014 5,070
Dilutive effect of employee stock plans 80 59 60
Diluted weighted average common shares outstanding 5,128 5,073 5,130
Basic earnings per share $ 1.69 $ 1.22 $ 1.10
Diluted earnings per share $ 1.67 $ 1.21 $ 1.09
Shares subject to anti-dilutive stock options and restricted stock-based awards excluded from calculation(1) 57 141 173
(1) These weighted shares relate to anti-dilutive stock options and restricted stock-based awards as calculated using the treasury stock method (described above) and could be dilutive in
the future. See Note 14 for information regarding the exercise prices of our outstanding, unexercised options.
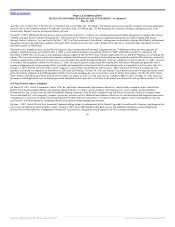
18. LEGAL PROCEEDINGS
EpicRealm/Parallel Networks Intellectual Property Litigation
On June 30, 2006, we filed a declaratory judgment action against EpicRealm Licensing, LP (“EpicRealm”) in the United States District Court, District of
Delaware, seeking a judicial declaration of noninfringement and
130
Source: ORACLE CORP, 10-K, June 28, 2011 Powered by Morningstar® Document Research℠