Oracle 2010 Annual Report Download - page 202
Download and view the complete annual report
Please find page 202 of the 2010 Oracle annual report below. You can navigate through the pages in the report by either clicking on the pages listed below, or by using the keyword search tool below to find specific information within the annual report.-
 1
1 -
2
-
3
-
4
-
5
-
6
-
7
-
8
-
9
-
10
-
11
-
12
-
13
-
14
-
15
-
16
-
17
-
18
-
19
-
20
-
21
-
22
-
23
-
24
-
25
-
26
-
27
-
28
-
29
-
30
-
31
-
32
-
33
-
34
-
35
-
36
-
37
-
38
-
39
-
40
-
41
-
42
-
43
-
44
-
45
-
46
-
47
-
48
-
49
-
50
-
51
-
52
-
53
-
54
-
55
-
56
-
57
-
58
-
59
-
60
-
61
-
62
-
63
-
64
-
65
-
66
-
67
-
68
-
69
-
70
-
71
-
72
-
73
-
74
-
75
-
76
-
77
-
78
-
79
-
80
-
81
-
82
-
83
-
84
-
85
-
86
-
87
-
88
-
89
-
90
-
91
-
92
-
93
-
94
-
95
-
96
-
97
-
98
-
99
-
100
-
101
-
102
-
103
-
104
-
105
-
106
-
107
-
108
-
109
-
110
-
111
-
112
-
113
-
114
-
115
-
116
-
117
-
118
-
119
-
120
-
121
-
122
-
123
-
124
-
125
-
126
-
127
-
128
-
129
-
130
-
131
-
132
-
133
-
134
-
135
-
136
-
137
-
138
-
139
-
140
-
141
-
142
-
143
-
144
-
145
-
146
-
147
-
148
-
149
-
150
-
151
-
152
-
153
-
154
-
155
-
156
-
157
-
158
-
159
-
160
-
161
-
162
-
163
-
164
-
165
-
166
-
167
-
168
-
169
-
170
-
171
-
172
-
173
-
174
-
175
-
176
-
177
-
178
-
179
-
180
-
181
-
182
-
183
-
184
-
185
-
186
-
187
-
188
-
189
-
190
-
191
-
 192
192 -
 193
193 -
 194
194 -
 195
195 -
 196
196 -
 197
197 -
 198
198 -
 199
199 -
 200
200 -
 201
201 -
 202
202 -
 203
203 -
 204
204 -
 205
205 -
 206
206 -
 207
207 -
 208
208 -
 209
209 -
 210
210 -
 211
211 -
 212
212 -
213
-
214
-
215
-
216
-
217
-
218
-
219
-
220
-
221
-
222
-
223
-
224
-
225
-
226
-
227
-
228
-
229
-
230
-
231
-
232
-
233
-
234
-
235
-
236
-
237
-
238
-
239
-
240
-
241
-
242
-
243
-
244
-
245
-
246
-
247
-
248
-
249
-
250
-
251
-
252
-
253
-
254
-
255
-
256
-
257
-
258
-
259
-
260
-
261
-
262
-
263
-
264
-
265
-
266
-
267
-
268
-
269
-
270
-
271
-
272
 |
 |

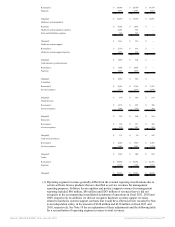
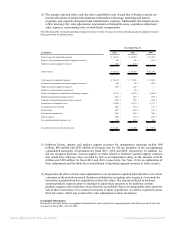
Revenues(1) $ 24,096 $ 20,700 $ 19,109
Expenses 5,836 4,938 5,018
Margin(2) $ 18,260 $ 15,762 $ 14,091
Hardware systems products:
Revenues $ 4,382 $ 1,493 $ —
Hardware systems products expenses 2,061 850 —
Sales and distribution expenses 960 307 —
Margin(2) $ 1,361 $ 336 $ —
Hardware systems support:
Revenues(1) $ 2,710 $ 912 $ —
Hardware systems support expenses 1,221 408 —
Margin(2) $ 1,489 $ 504 $ —
Total hardware systems business:
Revenues(1) $ 7,092 $ 2,405 $ —
Expenses 4,242 1,565 —
Margin(2) $ 2,850 $ 840 $ —
Consulting:
Revenues(1) $ 2,901 $ 2,705 $ 3,221
Services expenses 2,331 2,319 2,686
Margin(2) $ 570 $ 386 $ 535
Cloud Services:
Revenues(1) $ 1,376 $ 887 $ 780
Services expenses 1,042 679 566
Margin(2) $ 334 $ 208 $ 214
Education:
Revenues(1) $ 385 $ 337 $ 385
Services expenses 270 247 282
Margin(2) $ 115 $ 90 $ 103
Total services business:
Revenues(1) $ 4,662 $ 3,929 $ 4,386
Services expenses 3,643 3,245 3,534
Margin(2) $ 1,019 $ 684 $ 852
Totals:
Revenues(1) $ 35,850 $ 27,034 $ 23,495
Expenses 13,721 9,748 8,552
Margin(2) $ 22,129 $ 17,286 $ 14,943
(1) Operating segment revenues generally differ from the external reporting classifications due to
certain software license products that are classified as service revenues for management
reporting purposes. Software license updates and product support revenues for management
reporting included $80 million, $86 million and $243 million of revenues that we did not
recognize in the accompanying consolidated statements of operations in fiscal 2011, 2010 and
2009, respectively. In addition, we did not recognize hardware systems support revenues
related to hardware systems support contracts that would have otherwise been recorded by Sun
as an independent entity, in the amount of $148 million and $128 million in fiscal 2011 and
2010, respectively. See Note 10 for an explanation of these adjustments and the following table
for a reconciliation of operating segment revenues to total revenues.
Source: ORACLE CORP, 10-K, June 28, 2011 Powered by Morningstar® Document Research℠