Oracle 2010 Annual Report Download - page 58
Download and view the complete annual report
Please find page 58 of the 2010 Oracle annual report below. You can navigate through the pages in the report by either clicking on the pages listed below, or by using the keyword search tool below to find specific information within the annual report.-
 1
1 -
2
-
3
-
4
-
5
-
6
-
7
-
8
-
9
-
10
-
11
-
12
-
13
-
14
-
15
-
16
-
17
-
18
-
19
-
20
-
21
-
22
-
23
-
24
-
25
-
26
-
27
-
28
-
29
-
30
-
31
-
32
-
33
-
34
-
35
-
36
-
37
-
38
-
39
-
40
-
41
-
42
-
43
-
44
-
45
-
46
-
47
-
 48
48 -
 49
49 -
 50
50 -
 51
51 -
 52
52 -
 53
53 -
 54
54 -
 55
55 -
 56
56 -
 57
57 -
 58
58 -
 59
59 -
 60
60 -
 61
61 -
 62
62 -
 63
63 -
 64
64 -
 65
65 -
 66
66 -
 67
67 -
 68
68 -
69
-
70
-
71
-
72
-
73
-
74
-
75
-
76
-
77
-
78
-
79
-
80
-
81
-
82
-
83
-
84
-
85
-
86
-
87
-
88
-
89
-
90
-
91
-
92
-
93
-
94
-
95
-
96
-
97
-
98
-
99
-
100
-
101
-
102
-
103
-
104
-
105
-
106
-
107
-
108
-
109
-
110
-
111
-
112
-
113
-
114
-
115
-
116
-
117
-
118
-
119
-
120
-
121
-
122
-
123
-
124
-
125
-
126
-
127
-
128
-
129
-
130
-
131
-
132
-
133
-
134
-
135
-
136
-
137
-
138
-
139
-
140
-
141
-
142
-
143
-
144
-
145
-
146
-
147
-
148
-
149
-
150
-
151
-
152
-
153
-
154
-
155
-
156
-
157
-
158
-
159
-
160
-
161
-
162
-
163
-
164
-
165
-
166
-
167
-
168
-
169
-
170
-
171
-
172
-
173
-
174
-
175
-
176
-
177
-
178
-
179
-
180
-
181
-
182
-
183
-
184
-
185
-
186
-
187
-
188
-
189
-
190
-
191
-
192
-
193
-
194
-
195
-
196
-
197
-
198
-
199
-
200
-
201
-
202
-
203
-
204
-
205
-
206
-
207
-
208
-
209
-
210
-
211
-
212
-
213
-
214
-
215
-
216
-
217
-
218
-
219
-
220
-
221
-
222
-
223
-
224
-
225
-
226
-
227
-
228
-
229
-
230
-
231
-
232
-
233
-
234
-
235
-
236
-
237
-
238
-
239
-
240
-
241
-
242
-
243
-
244
-
245
-
246
-
247
-
248
-
249
-
250
-
251
-
252
-
253
-
254
-
255
-
256
-
257
-
258
-
259
-
260
-
261
-
262
-
263
-
264
-
265
-
266
-
267
-
268
-
269
-
270
-
271
-
272
 |
 |

Table of Contents
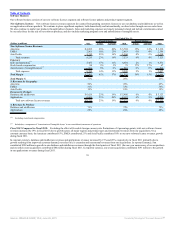
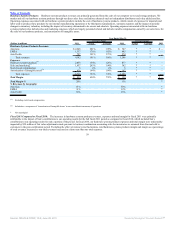
support contracts assumed will not be recognized during fiscal 2012 and 2013, respectively, that would have otherwise been recognized by Sun as an independent entity. To the extent
customers renew these support contracts, we expect to recognize revenues for the full contract value over the support renewal period.
(2) Represents the effects of fair value adjustments to our inventories acquired from Sun that were sold to customers in the post-combination period. Business combination accounting rules
require us to account for inventories assumed from our acquisitions at their fair values. The $29 million included in the hardware systems products expenses line in the table above is
intended to adjust these expenses to the hardware systems products expenses that would have been otherwise recorded by Sun as an independent entity upon the sale of these inventories. If
we acquire inventories in future acquisitions, we will be required to assess their fair values, which may result in fair value adjustments to those inventories.
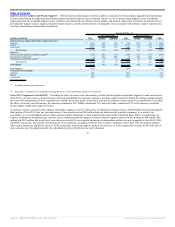
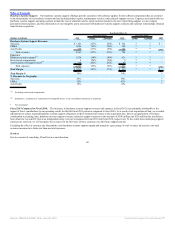
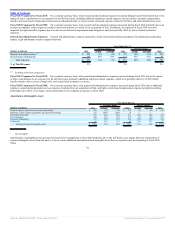
(3) Represents the amortization of intangible assets acquired in connection with our acquisitions. As of May 31, 2011, estimated future amortization expenses related to intangible assets were
as follows (in millions):
Fiscal 2012 $ 2,275
Fiscal 2013 1,902
Fiscal 2014 1,554
Fiscal 2015 1,155
Fiscal 2016 657
Thereafter 267
Total intangible assets subject to amortization 7,810
In-process research and development 50
Total intangible assets, net $ 7,860
(4) Acquisition related and other expenses primarily consist of personnel related costs for transitional and certain other employees, stock-based compensation expenses, integration related
professional services, certain business combination adjustments after the measurement period or purchase price allocation period has ended, and certain other operating expenses, net.
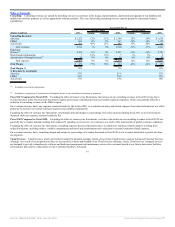
(5) Substantially all restructuring expenses during fiscal 2011 relate to employee severance, facility exit costs and contract termination costs in connection with our Sun Restructuring Plan.
Restructuring expenses during fiscal 2010 primarily relate to costs incurred pursuant to our Fiscal 2009 Oracle Restructuring Plan and Sun Restructuring Plan. Additional information
regarding certain of our restructuring plans is provided in Note 9 of Notes to Consolidated Financial Statements included elsewhere in this Annual Report.
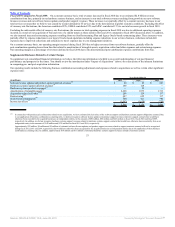
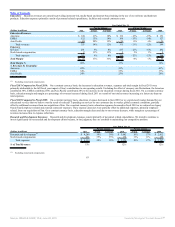
(6) Stock-based compensation is included in the following operating expense line items of our consolidated statements of operations (in millions):
Year Ended May 31,
2011 2010 2009
Sales and marketing $ 87 $ 81 $ 67
Software license updates and product support 14 17 13
Hardware systems products 2 3 —
Hardware systems support 5 2 —
Services 16 14 12
Research and development 231 172 155
General and administrative 145 132 93
Subtotal 500 421 340
Acquisition related and other 10 15 15
Total stock-based compensation $ 510 $ 436 $ 355
Stock-based compensation included in acquisition related and other expenses resulted from unvested stock options and restricted stock-based awards assumed from acquisitions whose
vesting was accelerated upon termination of the employees pursuant to the terms of those options and restricted stock-based awards.
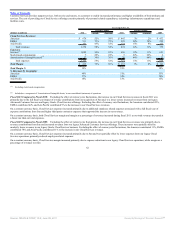
(7) The income tax effects presented were calculated as if the above described charges were not included in our results of operations for each of the respective periods presented. Income tax
effects were calculated based on the applicable jurisdictional tax rates applied to the items within the table above and resulted in an effective tax rate of 25.3% for fiscal 2011 instead of
25.1%, which represented our effective tax rate as derived per our consolidated statement of operations, primarily due to differences in jurisdictional tax rates, the related tax benefits
attributable to our restructuring expenses and the income tax effects related to our acquired tax exposures. Income tax effects were calculated reflecting an effective tax rate of 27.1% for
fiscal 2010 instead of 25.6%, which represented our effective tax rate as derived per our consolidated statement of operations, due to similar reasons as those noted for the fiscal 2011
differences. Income tax effects were calculated reflecting an effective tax rate of 28.7% for fiscal 2009 instead of 28.6%, which represented our effective tax rate as derived per our
consolidated statement of operations, due to the exclusion of the tax effect of an adjustment to our non-current deferred tax liability associated with acquired intangible assets.
54
Source: ORACLE CORP, 10-K, June 28, 2011 Powered by Morningstar® Document Research℠